Het kabinet houdt de situatie op de gasmarkt nauwlettend in de gaten. U leest hier actuele cijfers over de zekerheid van de gaslevering. Dit is de update van 5 augustus 2022.
- Vulling gasopslagen gaat gestaag door.
- Levering Russisch gas ongewijzigd ten opzichte van vorige week.
- De gasprijs blijft hoog.
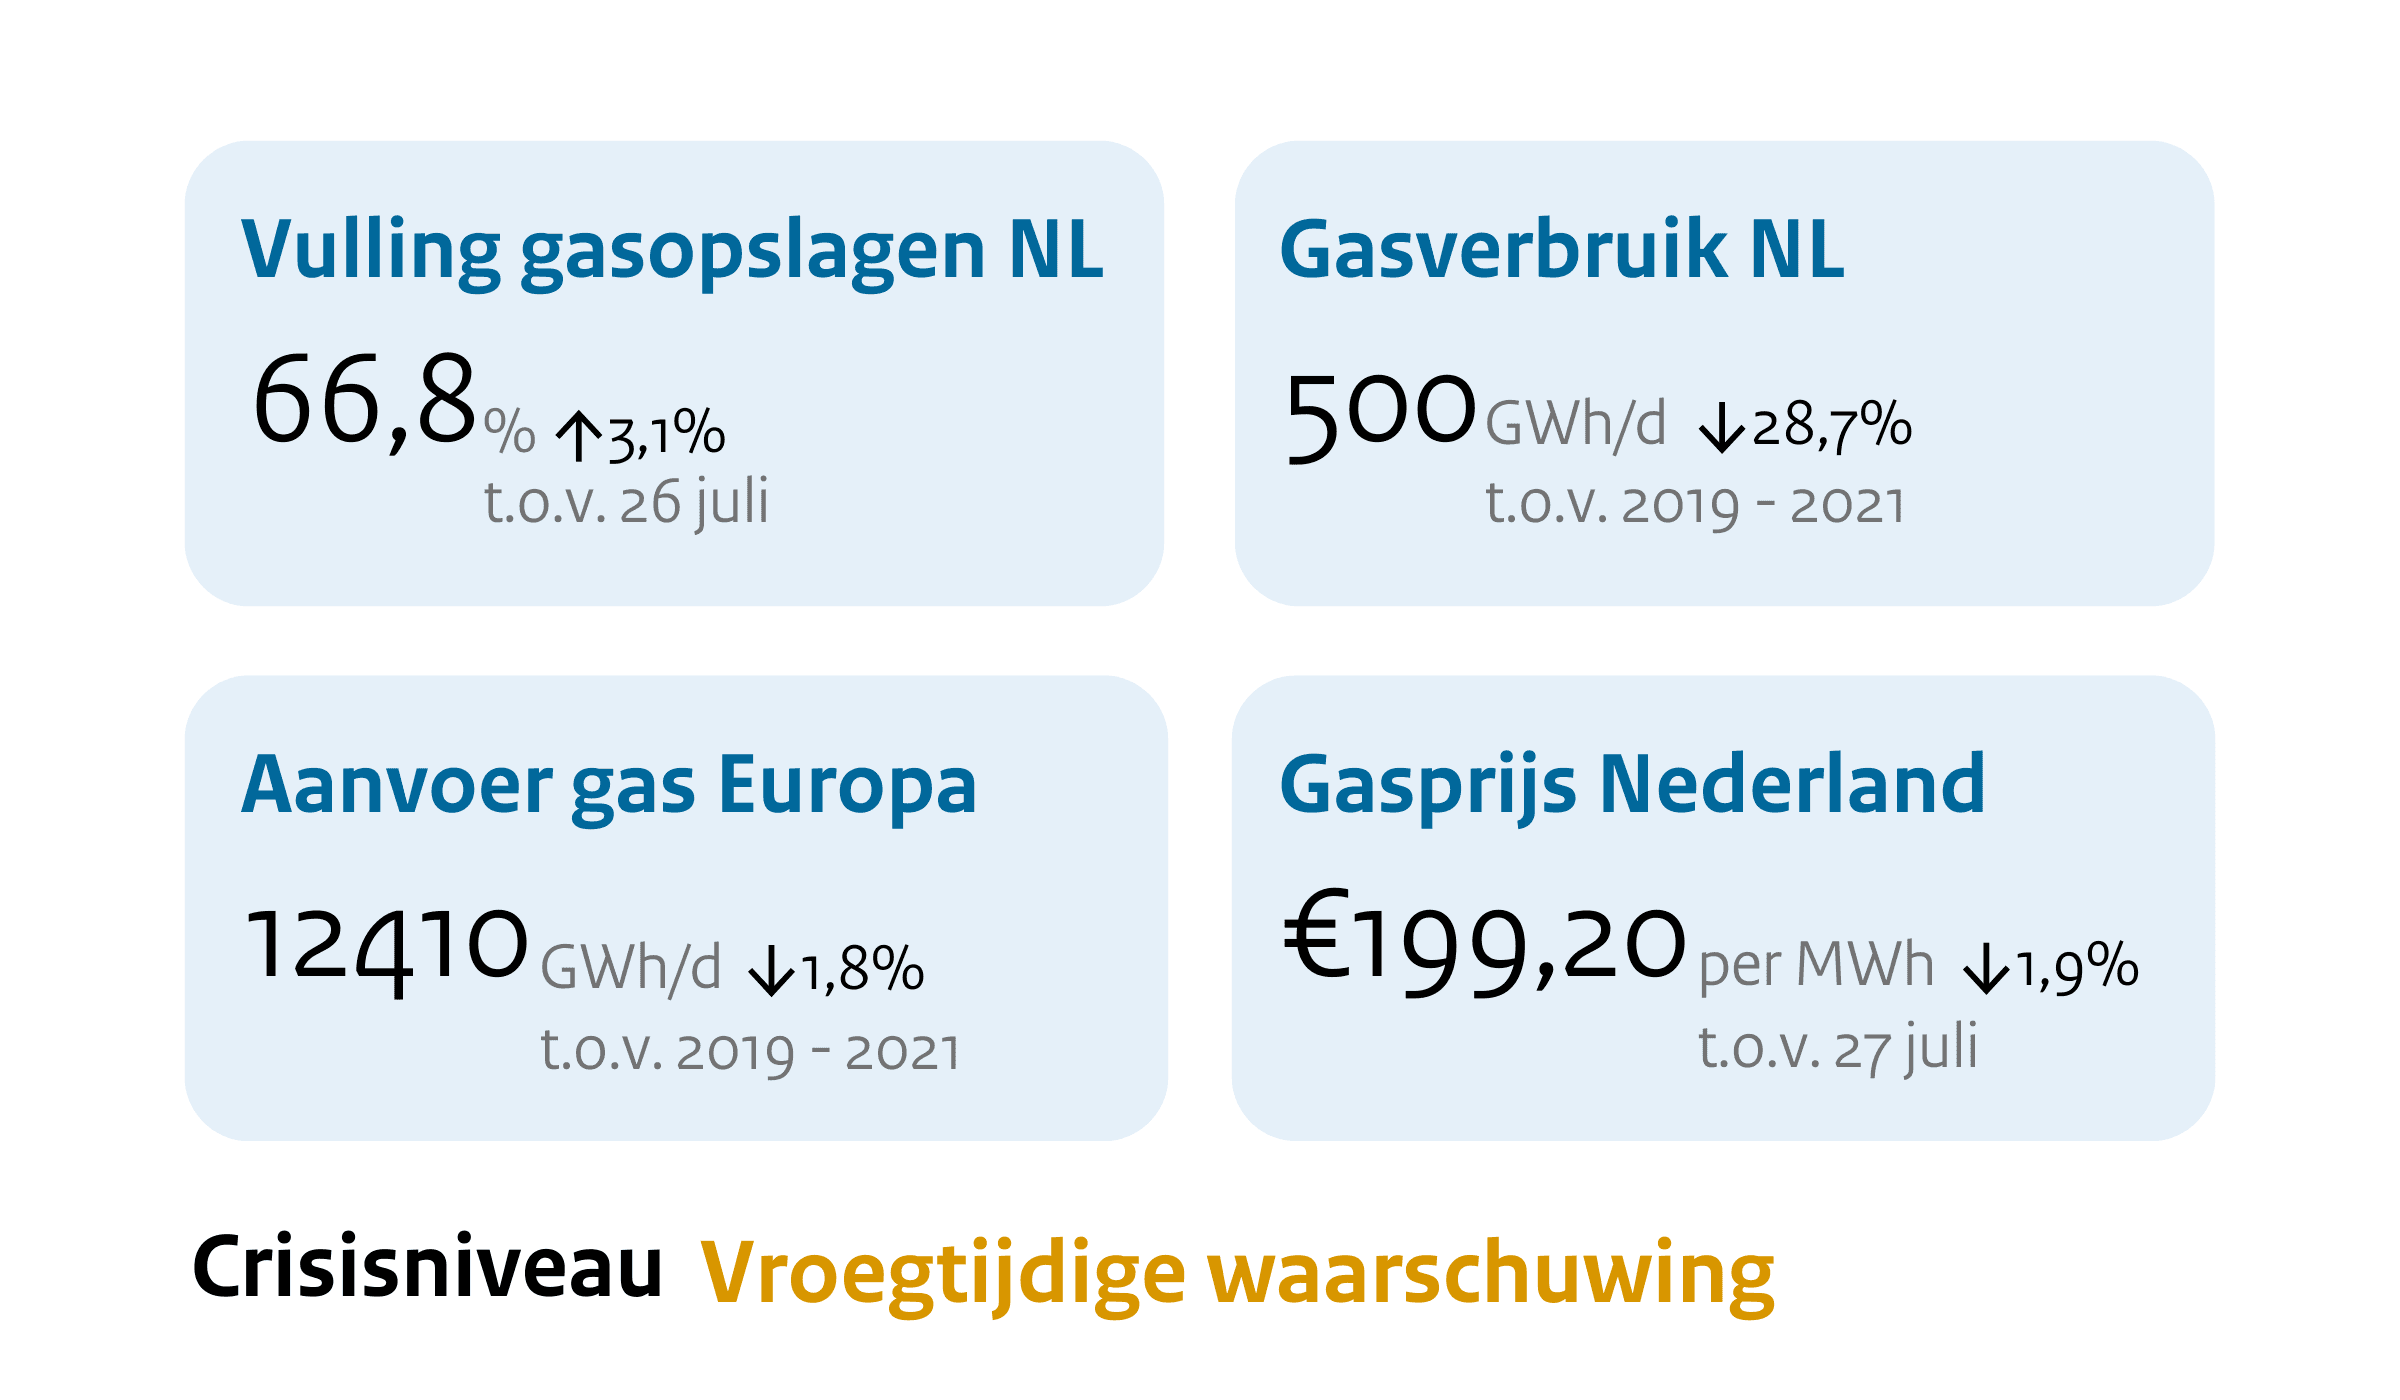
| Vulling gasopslagen | 66,8 % | Toename van 3,1 % t.o.v. 26 juli |
|---|---|---|
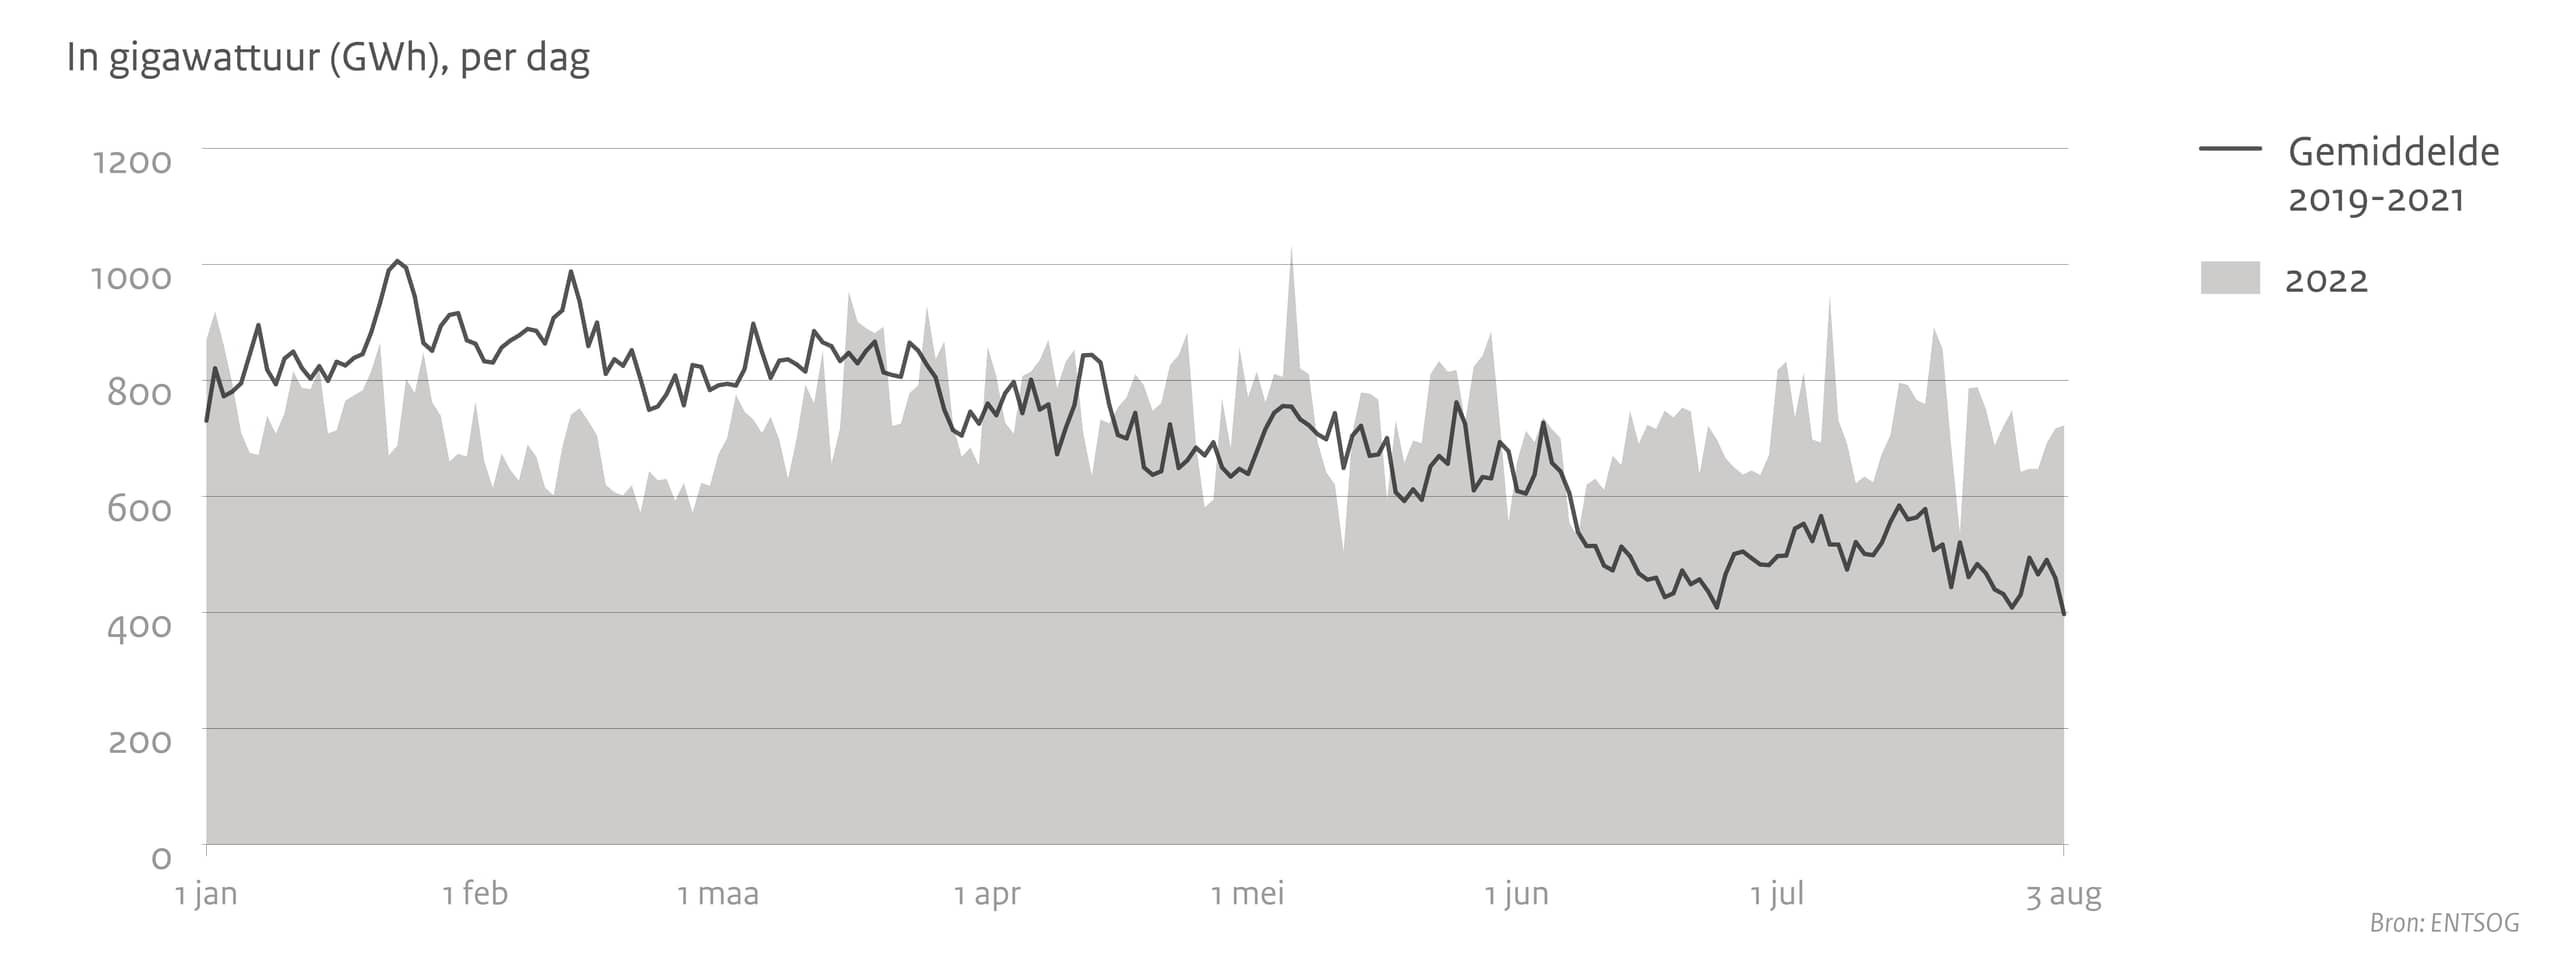
| Gemiddeld gasverbruik in Nederland | 500 GWh per dag | Afname van 28,7 % t.o.v. 2019-2021 |
| Gemiddelde aanvoer gas Europa per dag | 12410 GWh per dag | Afname van 1,8 % t.o.v. 2019-2021 |
| Gasprijs Europa | € 199,20 per MWh | Toename van 1,9 % t.o.v. 27 juli |
| Crisisniveau | Vroegtijdige waarschuwing |
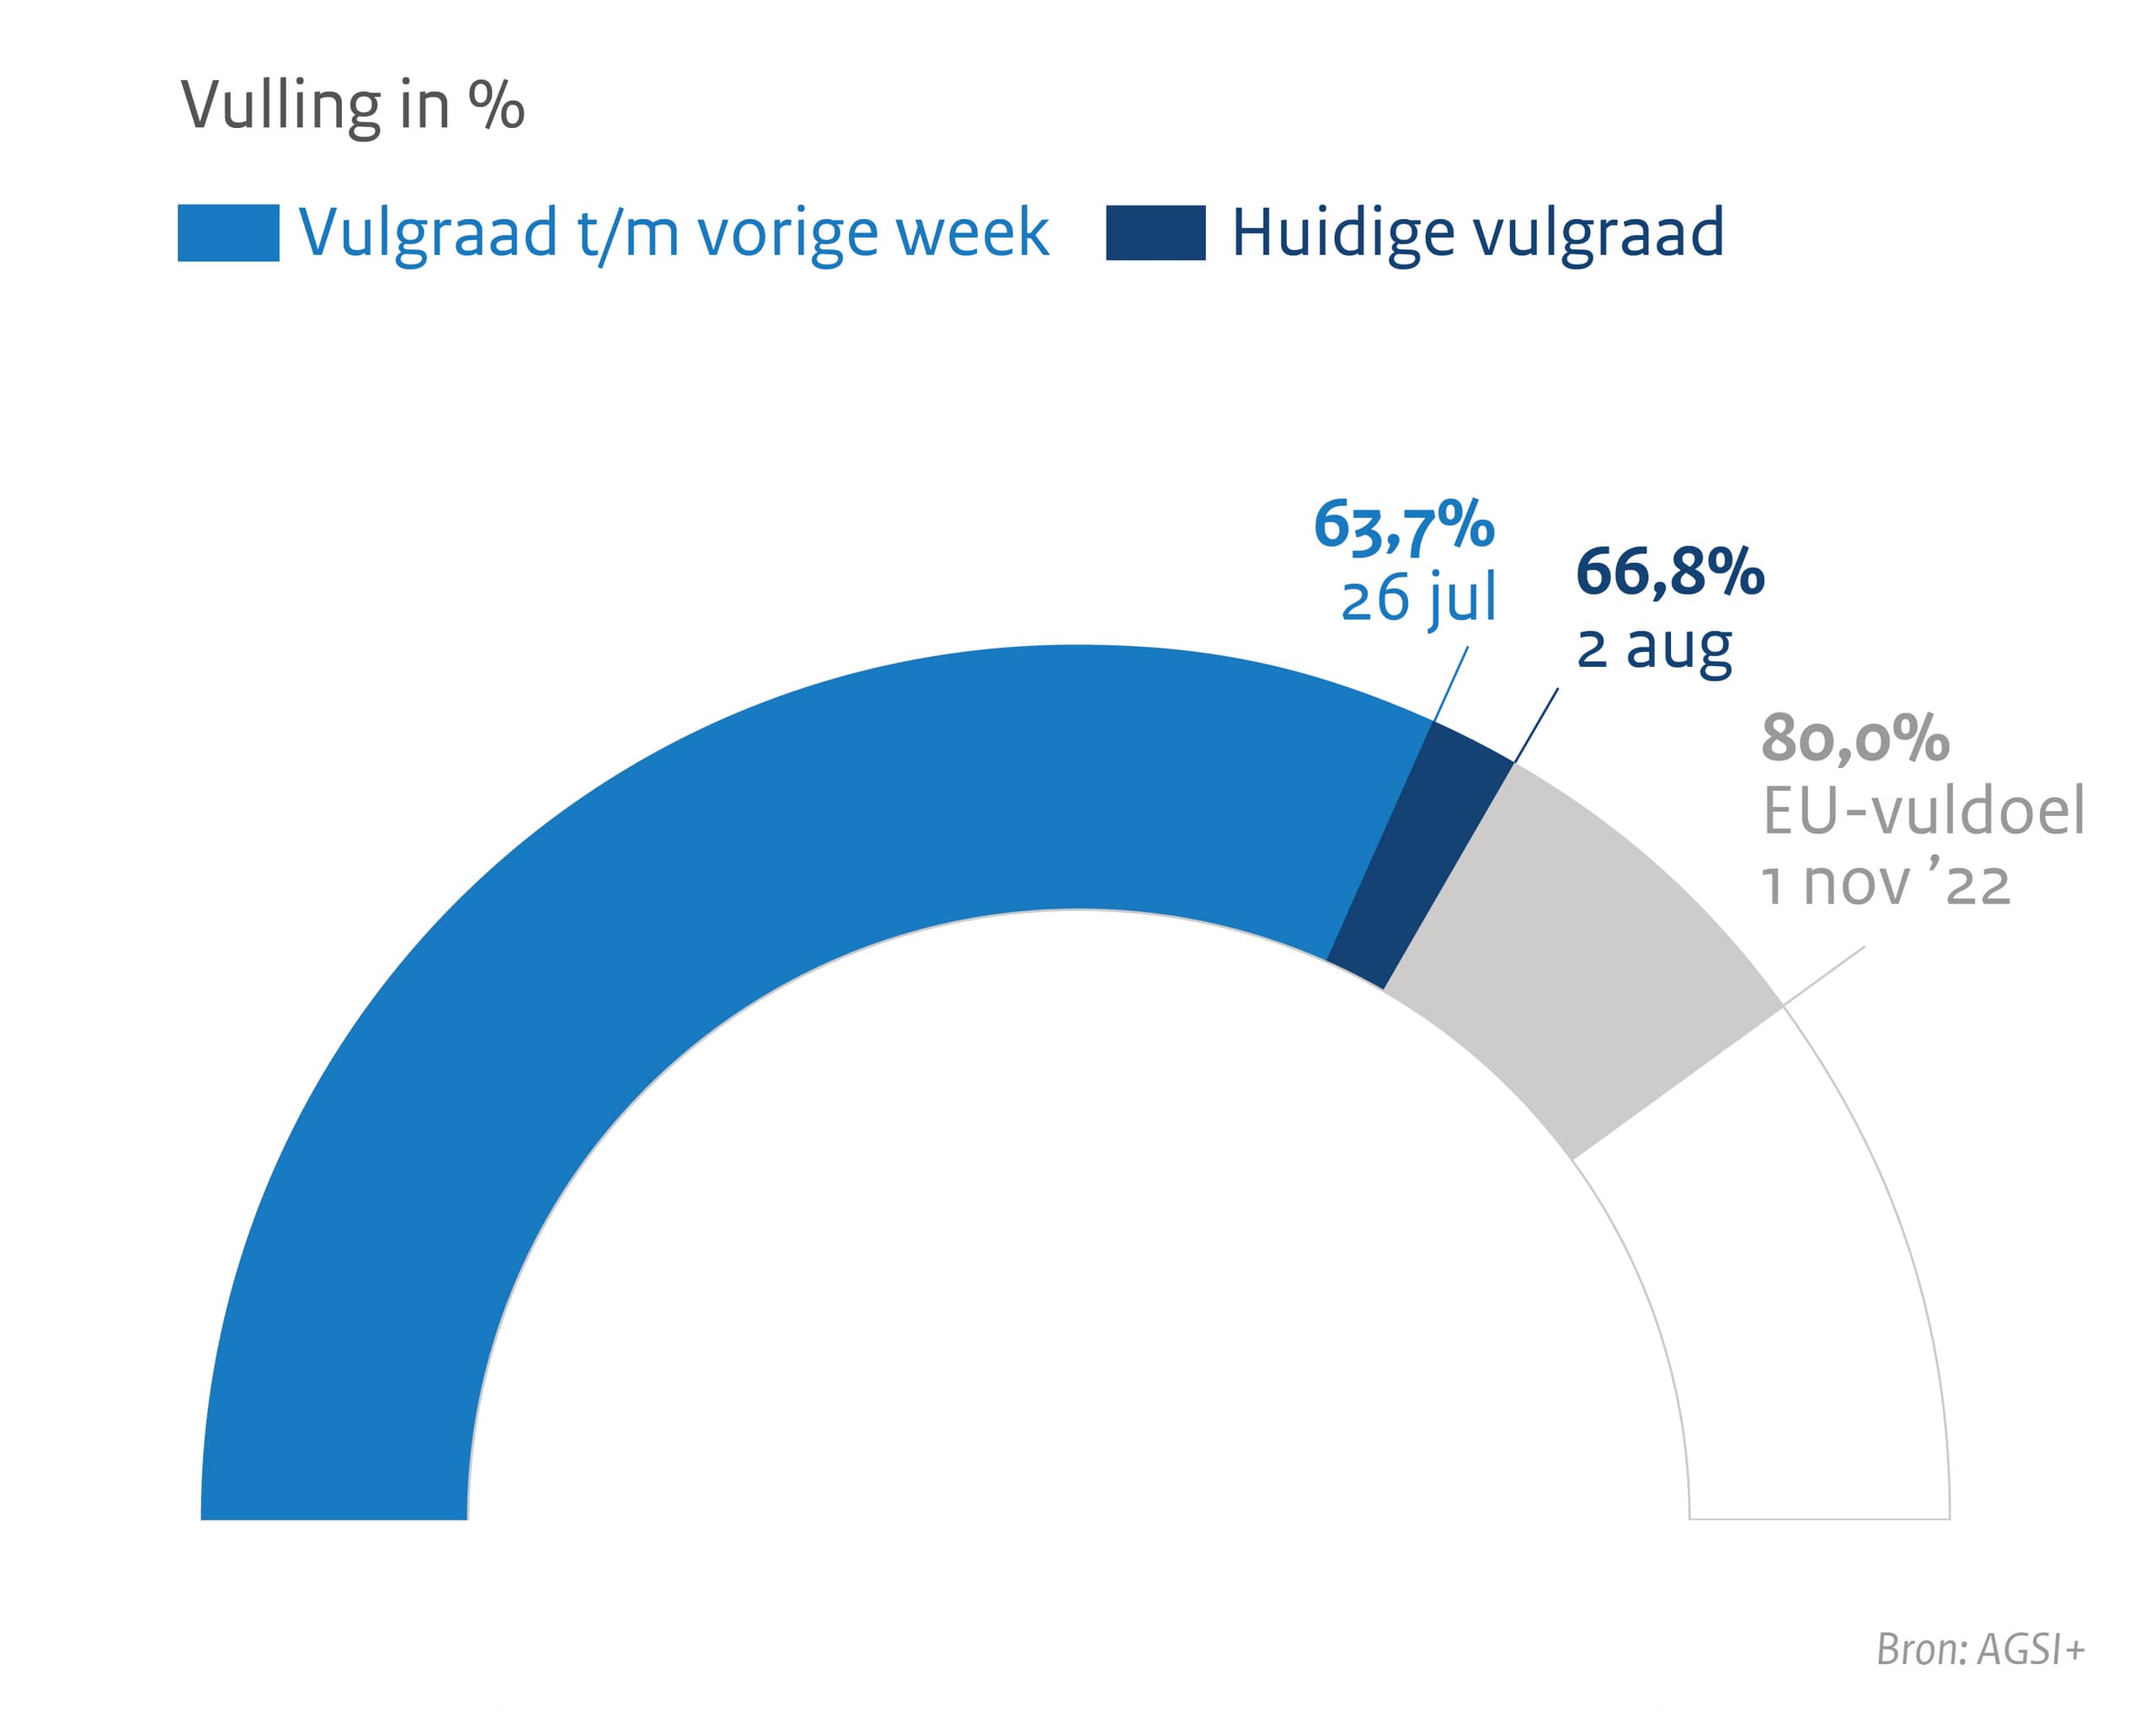
Vulling gasopslagen in Nederland
Data zoals bekend op 2 augustus 2022.
| 26 juli | 2 augustus | ||
|---|---|---|---|
| Vulgraad in % | 63,7 % | 66,8 % | |
| EU-vuldoel 1 november 2022 | 80% |
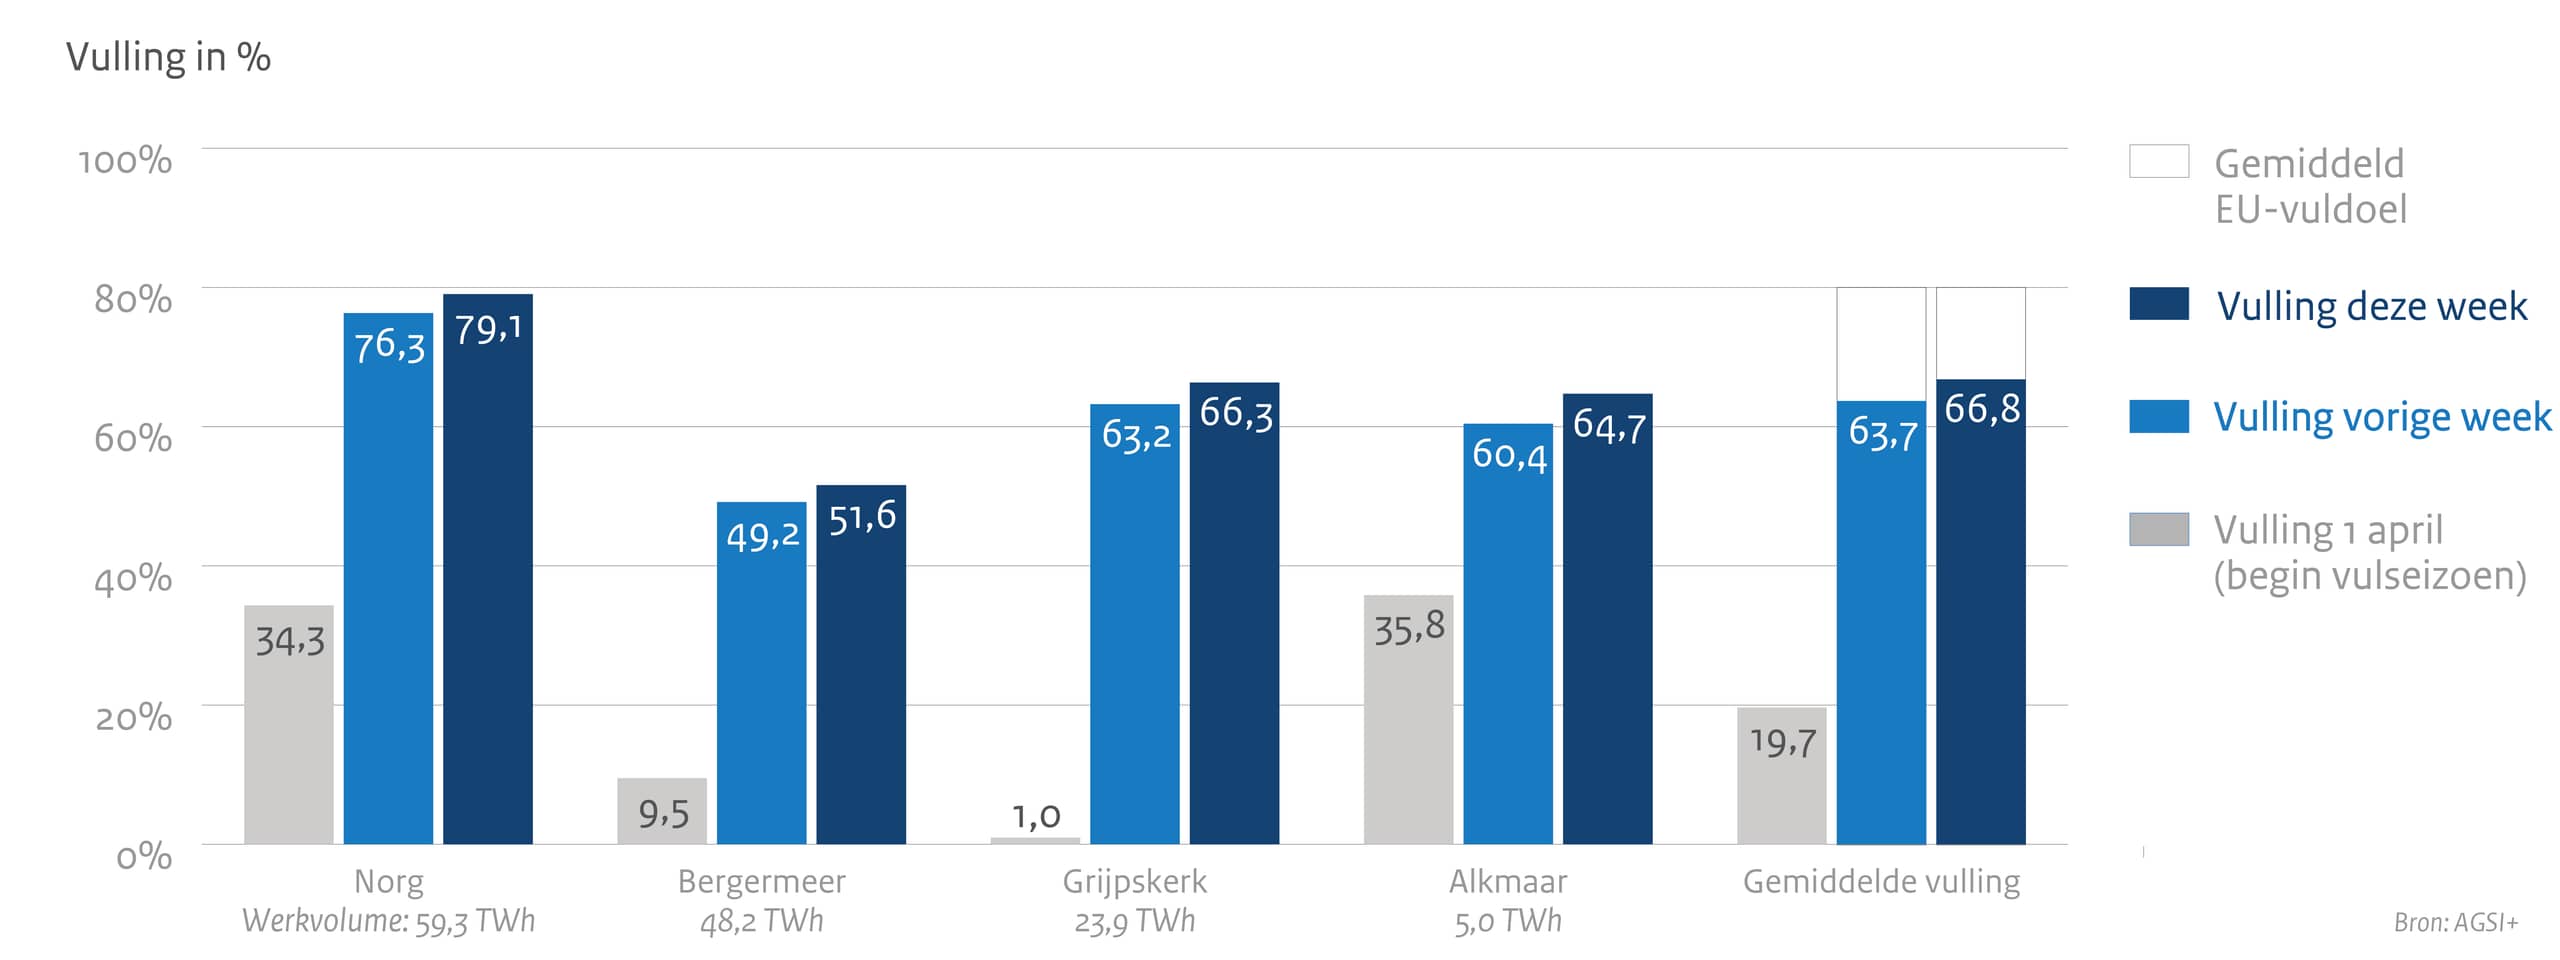
Vulling bergingen 2022
| Vulling in % |
Vulling 1 april (begin vulseizoen) | Vulling vorige week | Vulling deze week | Gemiddeld EU-vuldoel |
|---|---|---|---|---|
|
Norg Werkvolume 59,3 TWh | 34,3 % | 76,3 % | 79,1 % | |
|
Bergermeer Werkvolume 48,2 TWh | 9,5 % | 49,2 % | 51,6 % | |
|
Grijpskerk Werkvolume 23,9 TWh | 1,0 % | 63,2 % | 66,3 % | |
|
Alkmaar Werkvolume 5,0 TWh | 35,8 % | 60,4 % | 64,7 % | |
| Gemiddelde vulling | 19,7 % | 63,7 % | 66,8 % | 80 % |
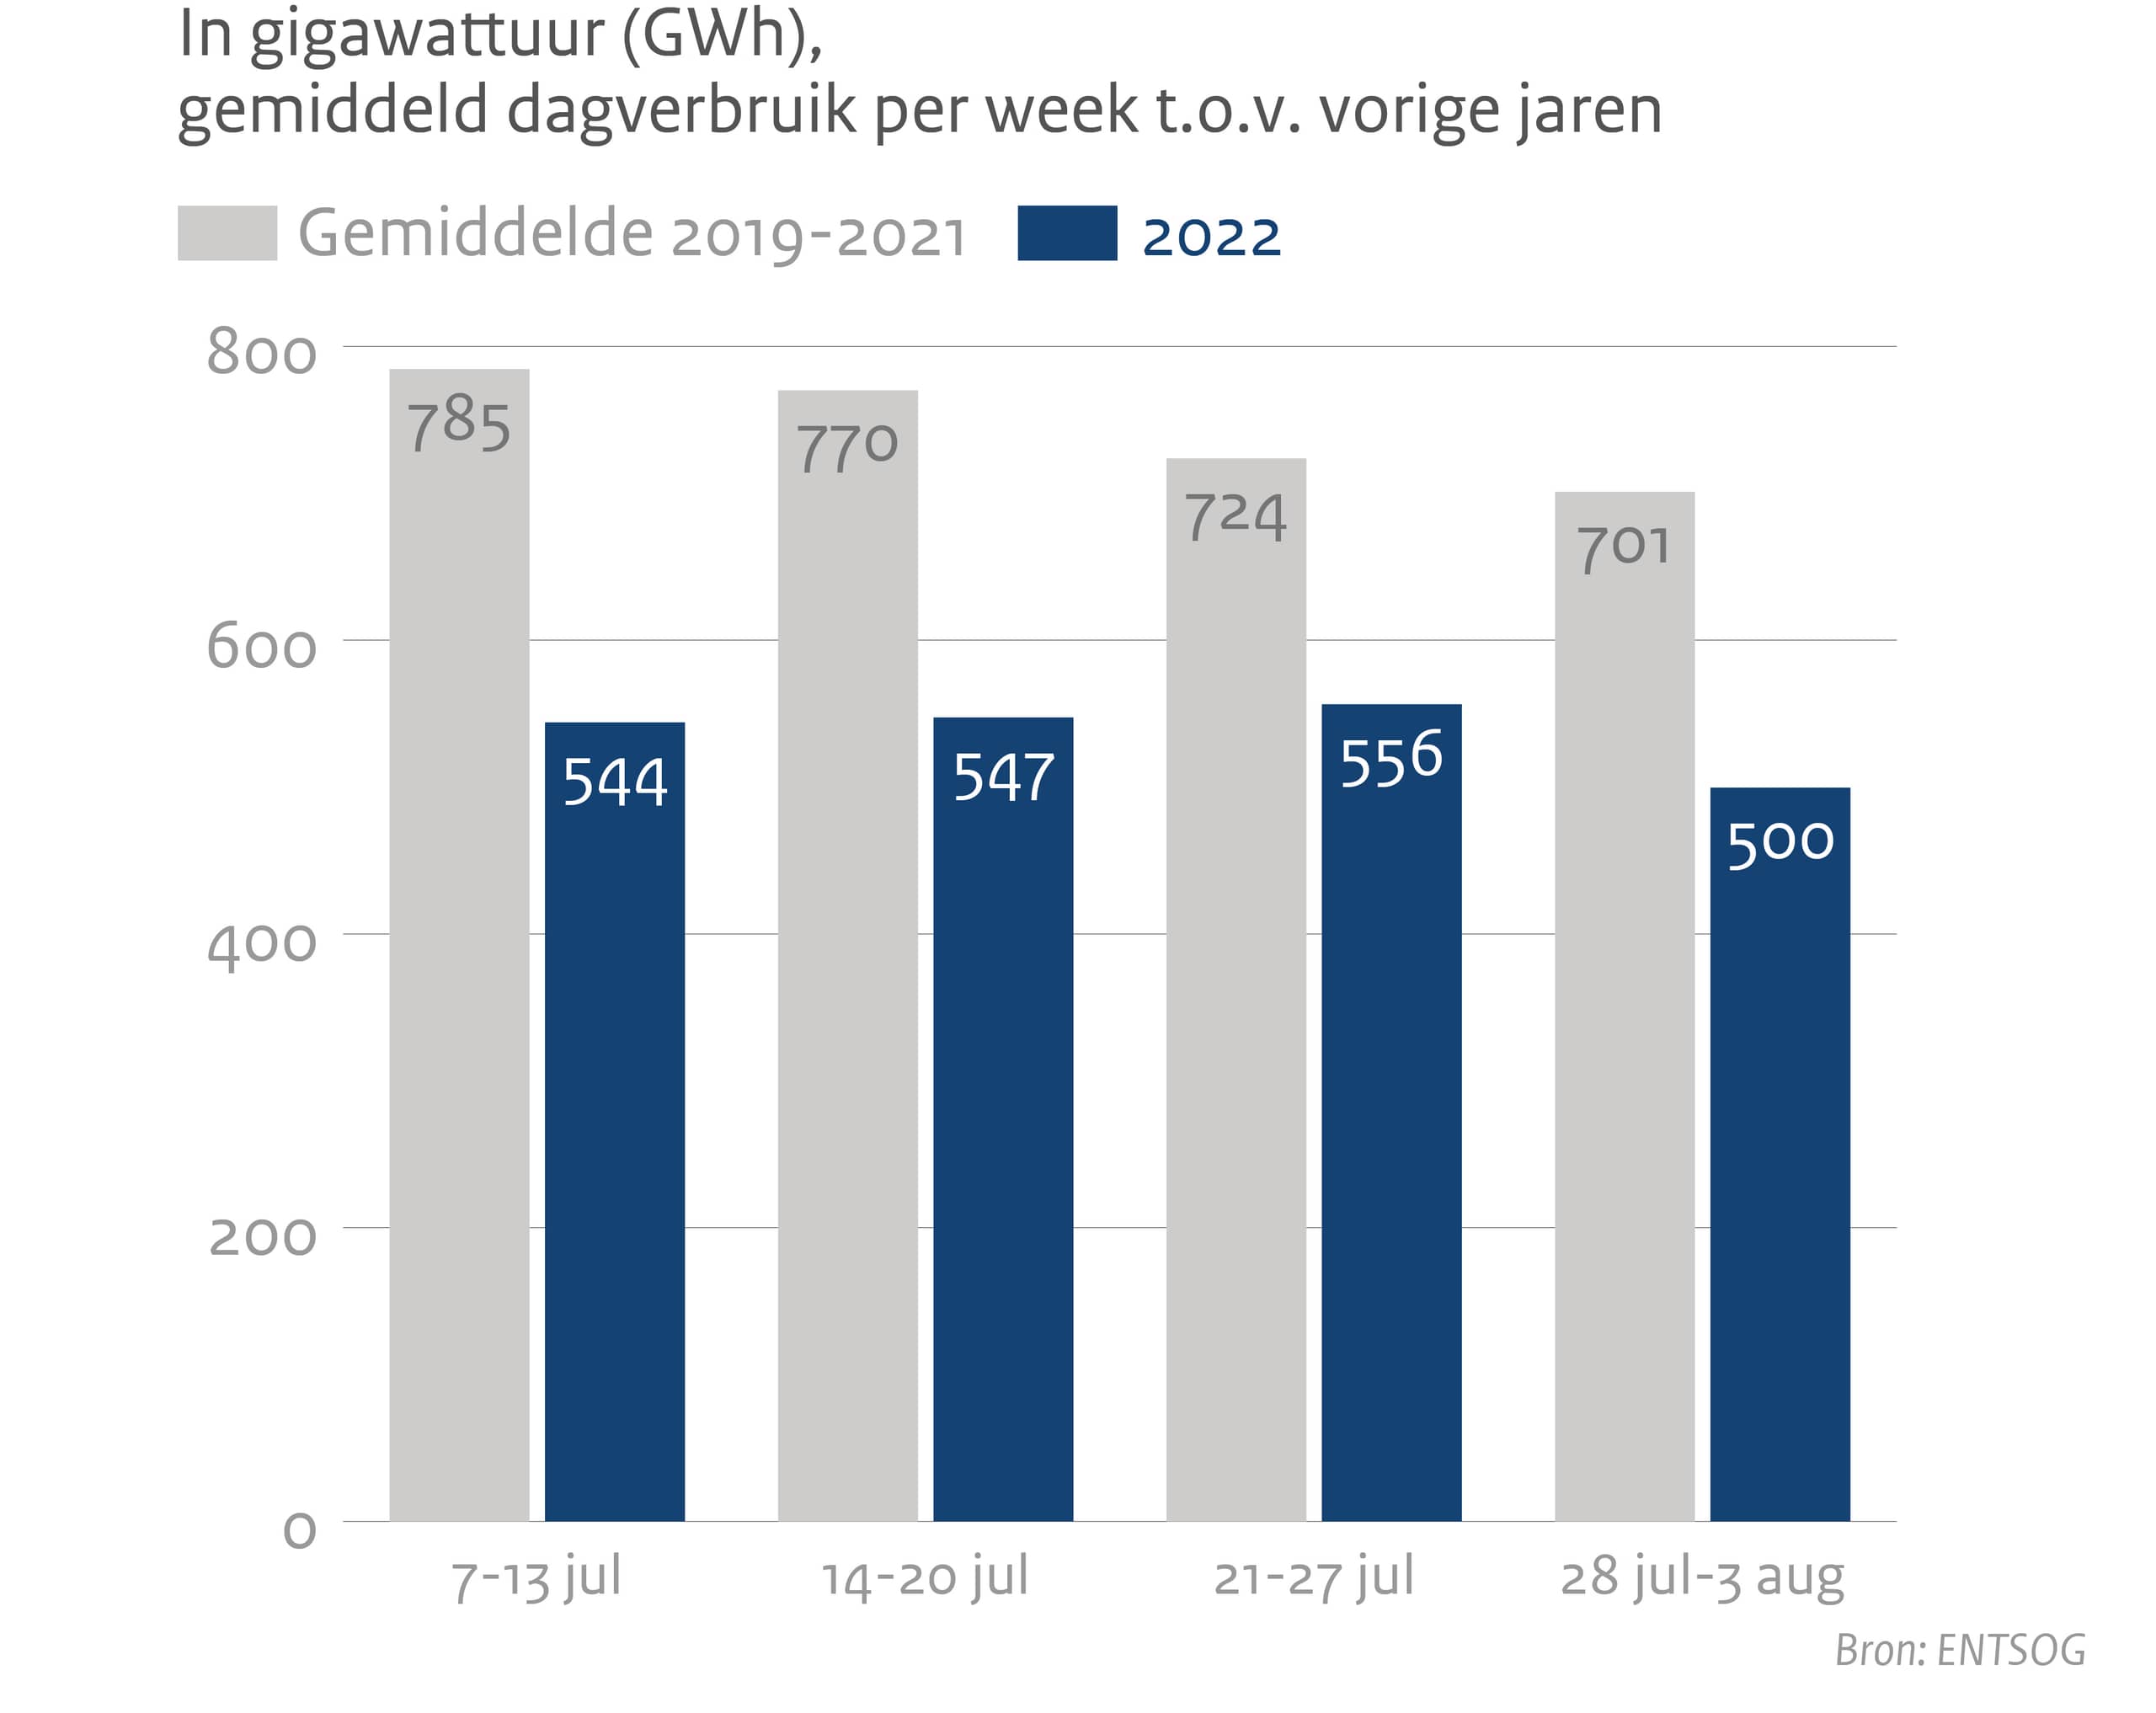
Gasverbruik in Nederland
| Gemiddelde 2019-2021 | 2022 | |
|---|---|---|
| 7 juli - 13 juli | 785 GWh | 544 GWh |
| 14 juli - 20 juli | 770 GWh | 547 GWh |
| 21 juli - 27 juli | 724 GWh | 556 GWh |
| 28 juli - 3 augustus | 701 GWh | 500 GWh |
Aanvoer gas voor Europa
Aanvoer tussen 7 juli - 3 augustus in 2019-2021 en 2022
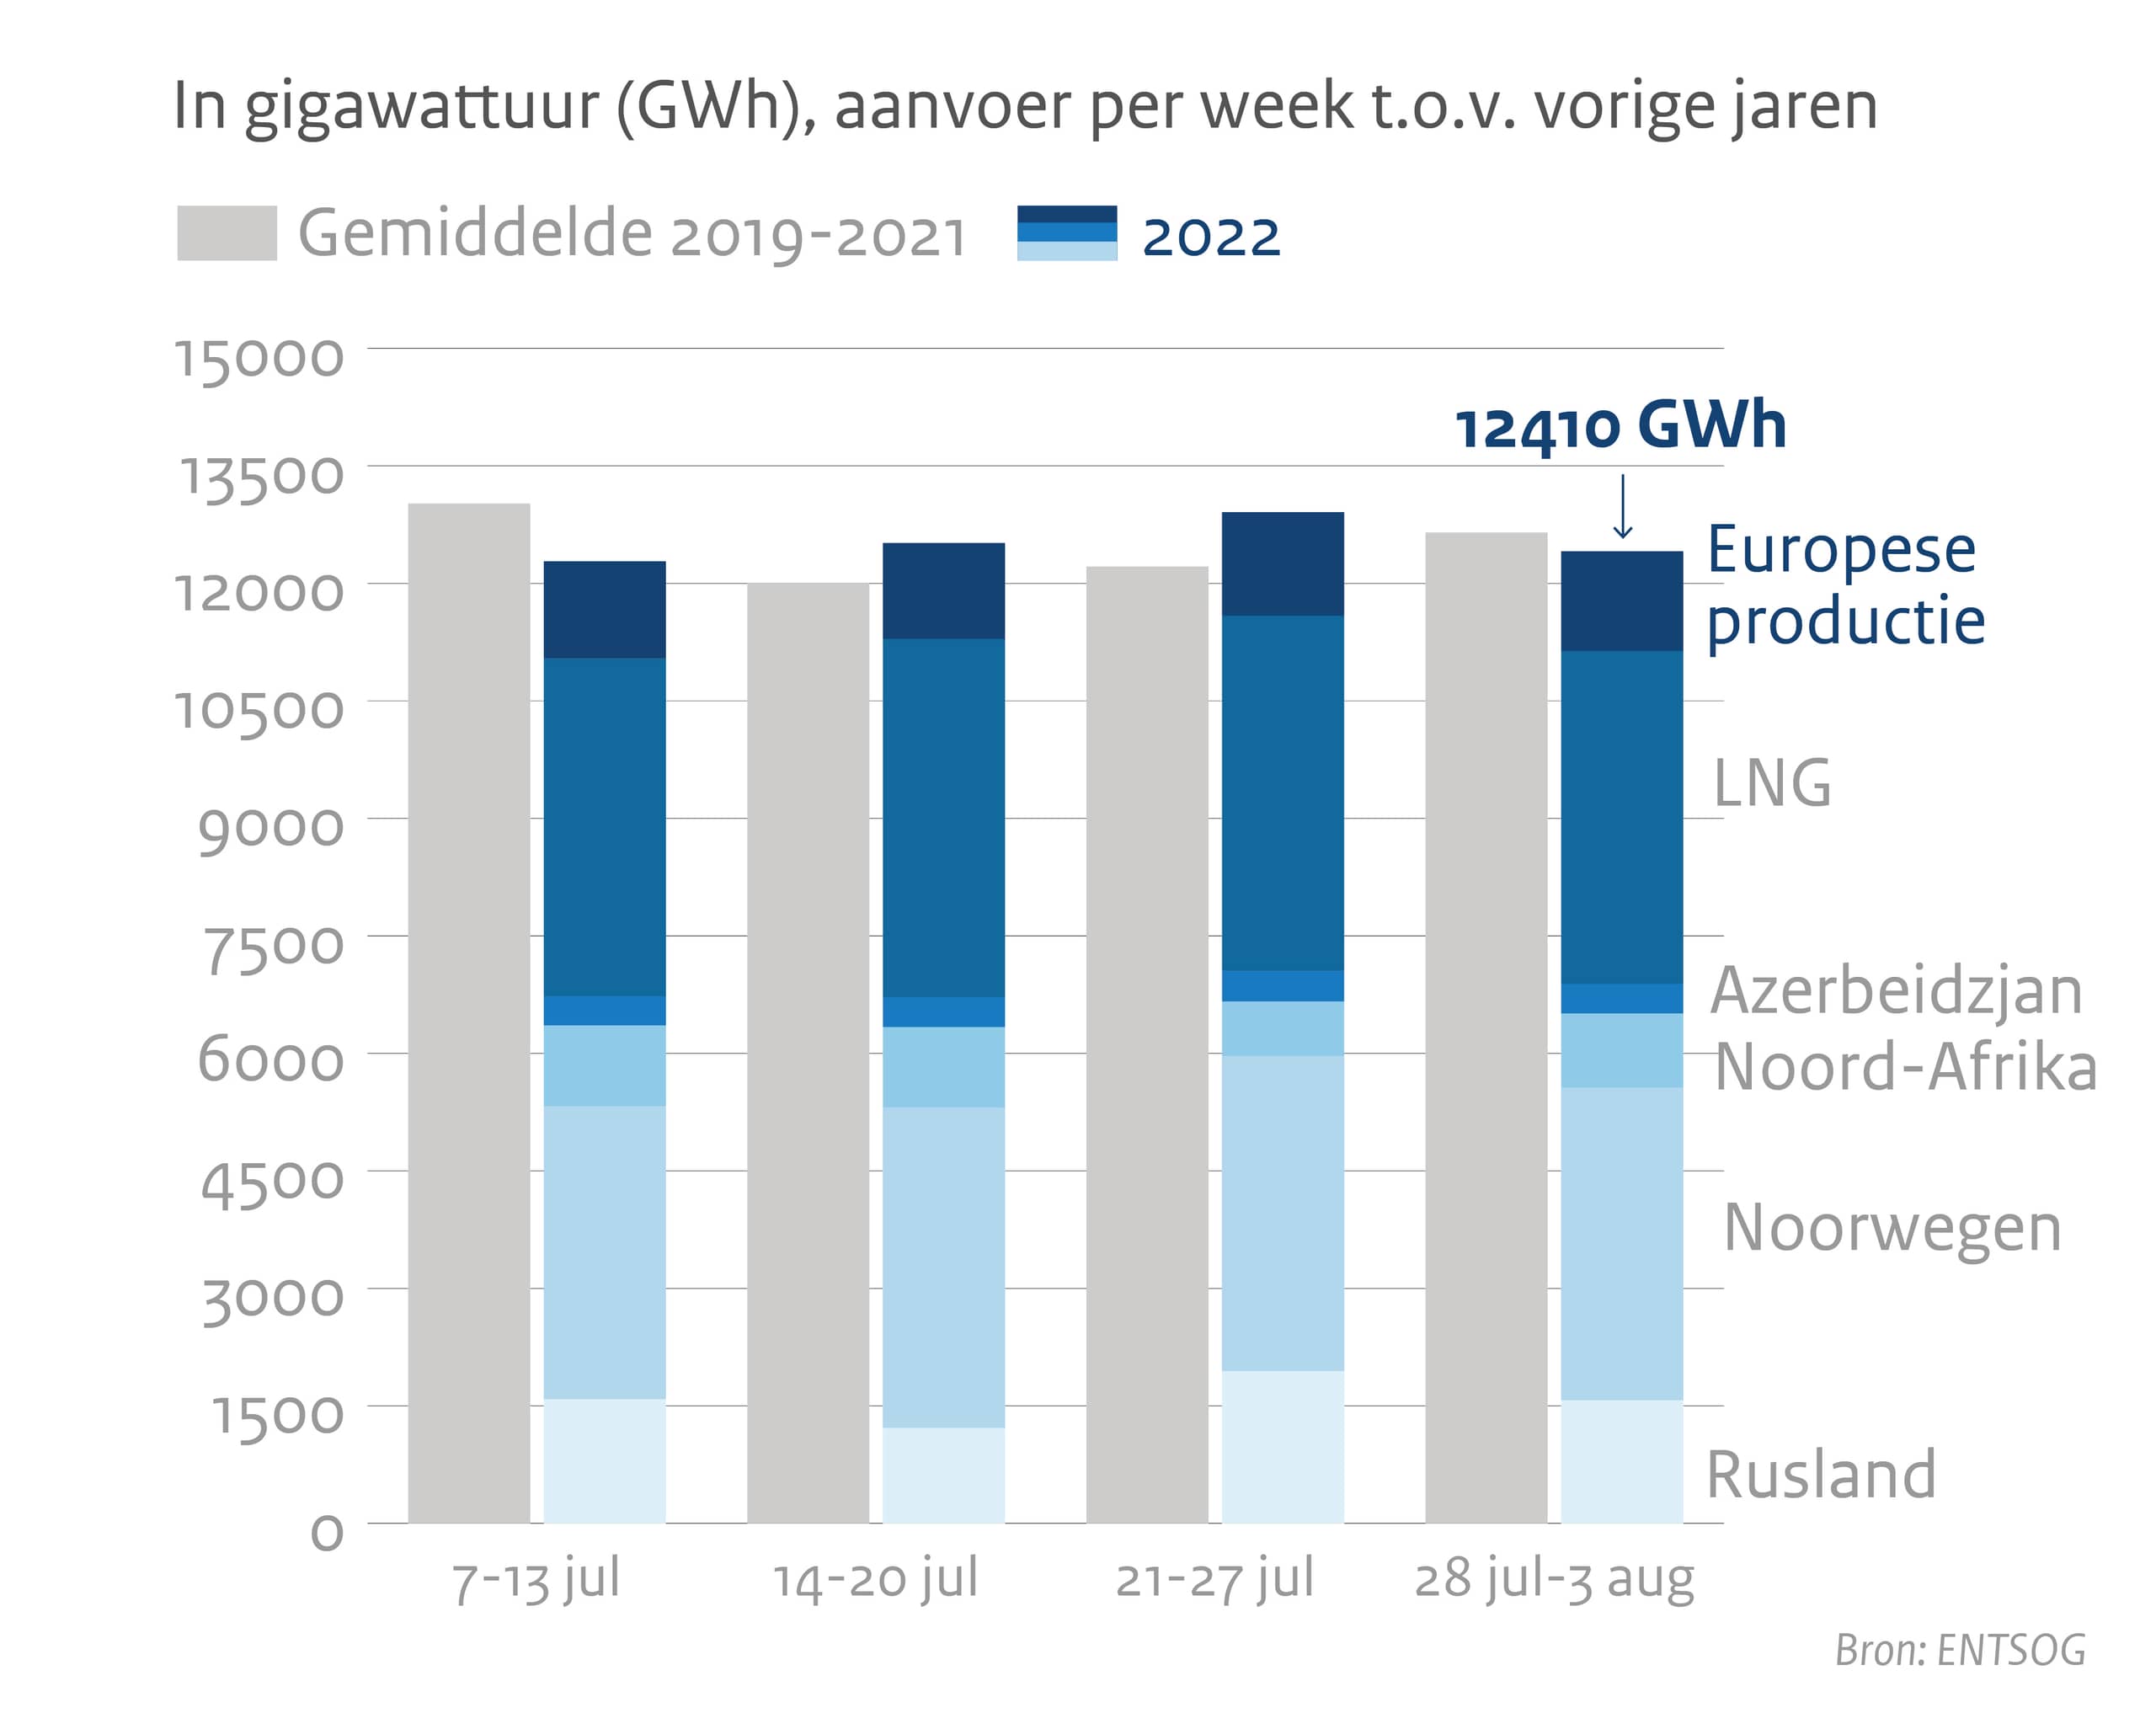
| 7 juli - 13 juli | 14 juli - 20 juli | 21 juli - 27 juli | 28 juli - 3 augustus | |
|---|---|---|---|---|
| Rusland | 1580,64 GWh | 1218,22 GWh | 1916,50 GWh | 1571,37 GWh |
| Noorwegen | 3719,80 GWh | 4087,23 GWh | 3962,35 GWh | 3988,07 GWh |
| Noord-Afrika | 1032,45 GWh | 1029,87 GWh | 700,52 GWh | 949,69 GWh |
|
Azerbeidzjan | 376,02 GWh | 382,23 GWh | 411,43 GWh | 375,85 GWh |
| Liquified Naturel GAS (LNG) | 4298,14 GWh | 4572,17 GWh | 4550,22 GWh | 4252,03 GWh |
| Europese productie | 1252,23 GWh | 1225,32 GWh | 1337,31 GWh | 1273,08 GWh |
2019-2021
Gemiddelde aanvoer van gas voor Europa per dag in 2019-2021
| 7 juli - 13 juli | 14 juli - 20 juli | 21 juli - 27 juli | 28 juli - 3 augustus | |
|---|---|---|---|---|
| Gemiddelde uit alle bronnen | 12281,78 GWh | 12515,04 GWh | 12909,04 GWh | 12649,19 GWh |
Aanvoer tussen 1 augustus 2021 - 3 augustus 2022
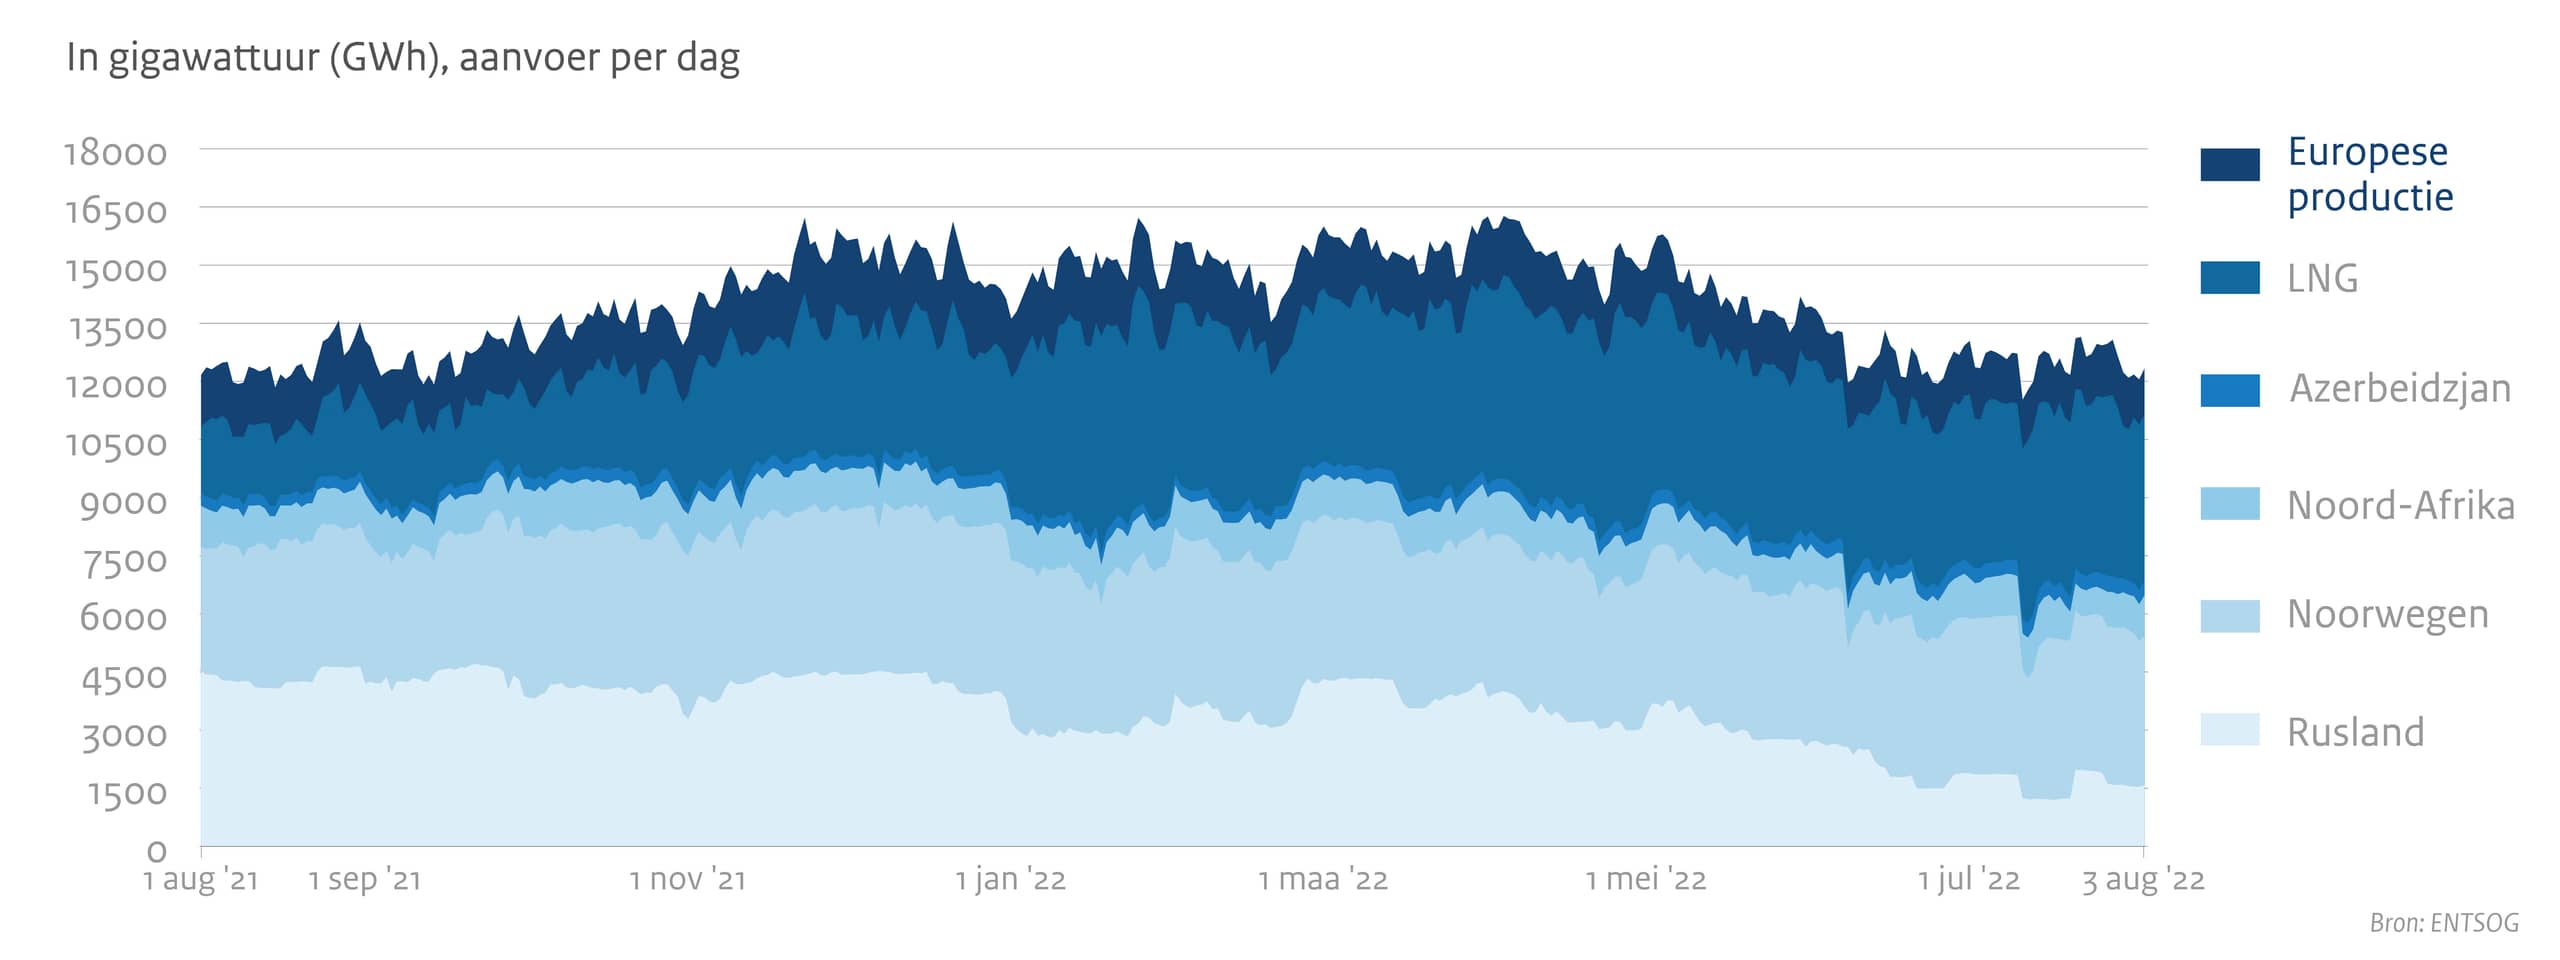
| Rusland | Noorwegen | Noord-Afrika | Azerbeidzjan | Liquified Naturel GAS (LNG) | Europese productie | |
|---|---|---|---|---|---|---|
| 1 augustus 2021 | 4516,12 GWh | 3212,14 GWh | 1057,68 GWh | 333,45 GWh | 1635,73 GWh | 1390,66 GWh |
| 1 september 2021 | 4195,76 GWh | 3770,47 GWh | 1124,5 GWh | 298,76 GWh | 2279,16 GWh | 1379,22 GWh |
| 1 november 2021 | 3283,91 GWh | 4216,11 GWh | 1067,07 GWh | 244,05 GWh | 2846,26 GWh | 1533,76 GWh |
| 1 januari 2022 | 3188,17 GWh | 4191,31 GWh | 1045,1 GWh | 314,72 GWh | 3348,21 GWh | 1524,56 GWh |
| 1 maart 2022 | 4320,03 GWh | 4248,31 GWh | 1028,22 GWh | 343,96 GWh | 4466,16 GWh | 1586,56 GWh |
| 1 mei 2022 | 3388,95 GWh | 3887,14 GWh | 1021,53 GWh | 366,96 GWh | 4883,64 GWh | 1372,08 GWh |
| 1 juli 2022 | 1877,99 GWh | 4002,02 GWh | 1034,49 GWh | 375,95 GWh | 4361,81 GWh | 1388,23 GWh |
| 3 augustus 2022 | 1577,87 GWh | 3846,32 GWh | 1050,87 GWh | 371,03 GWh | 4290,78 GWh | 1190,52 GWh |
Gasprijs
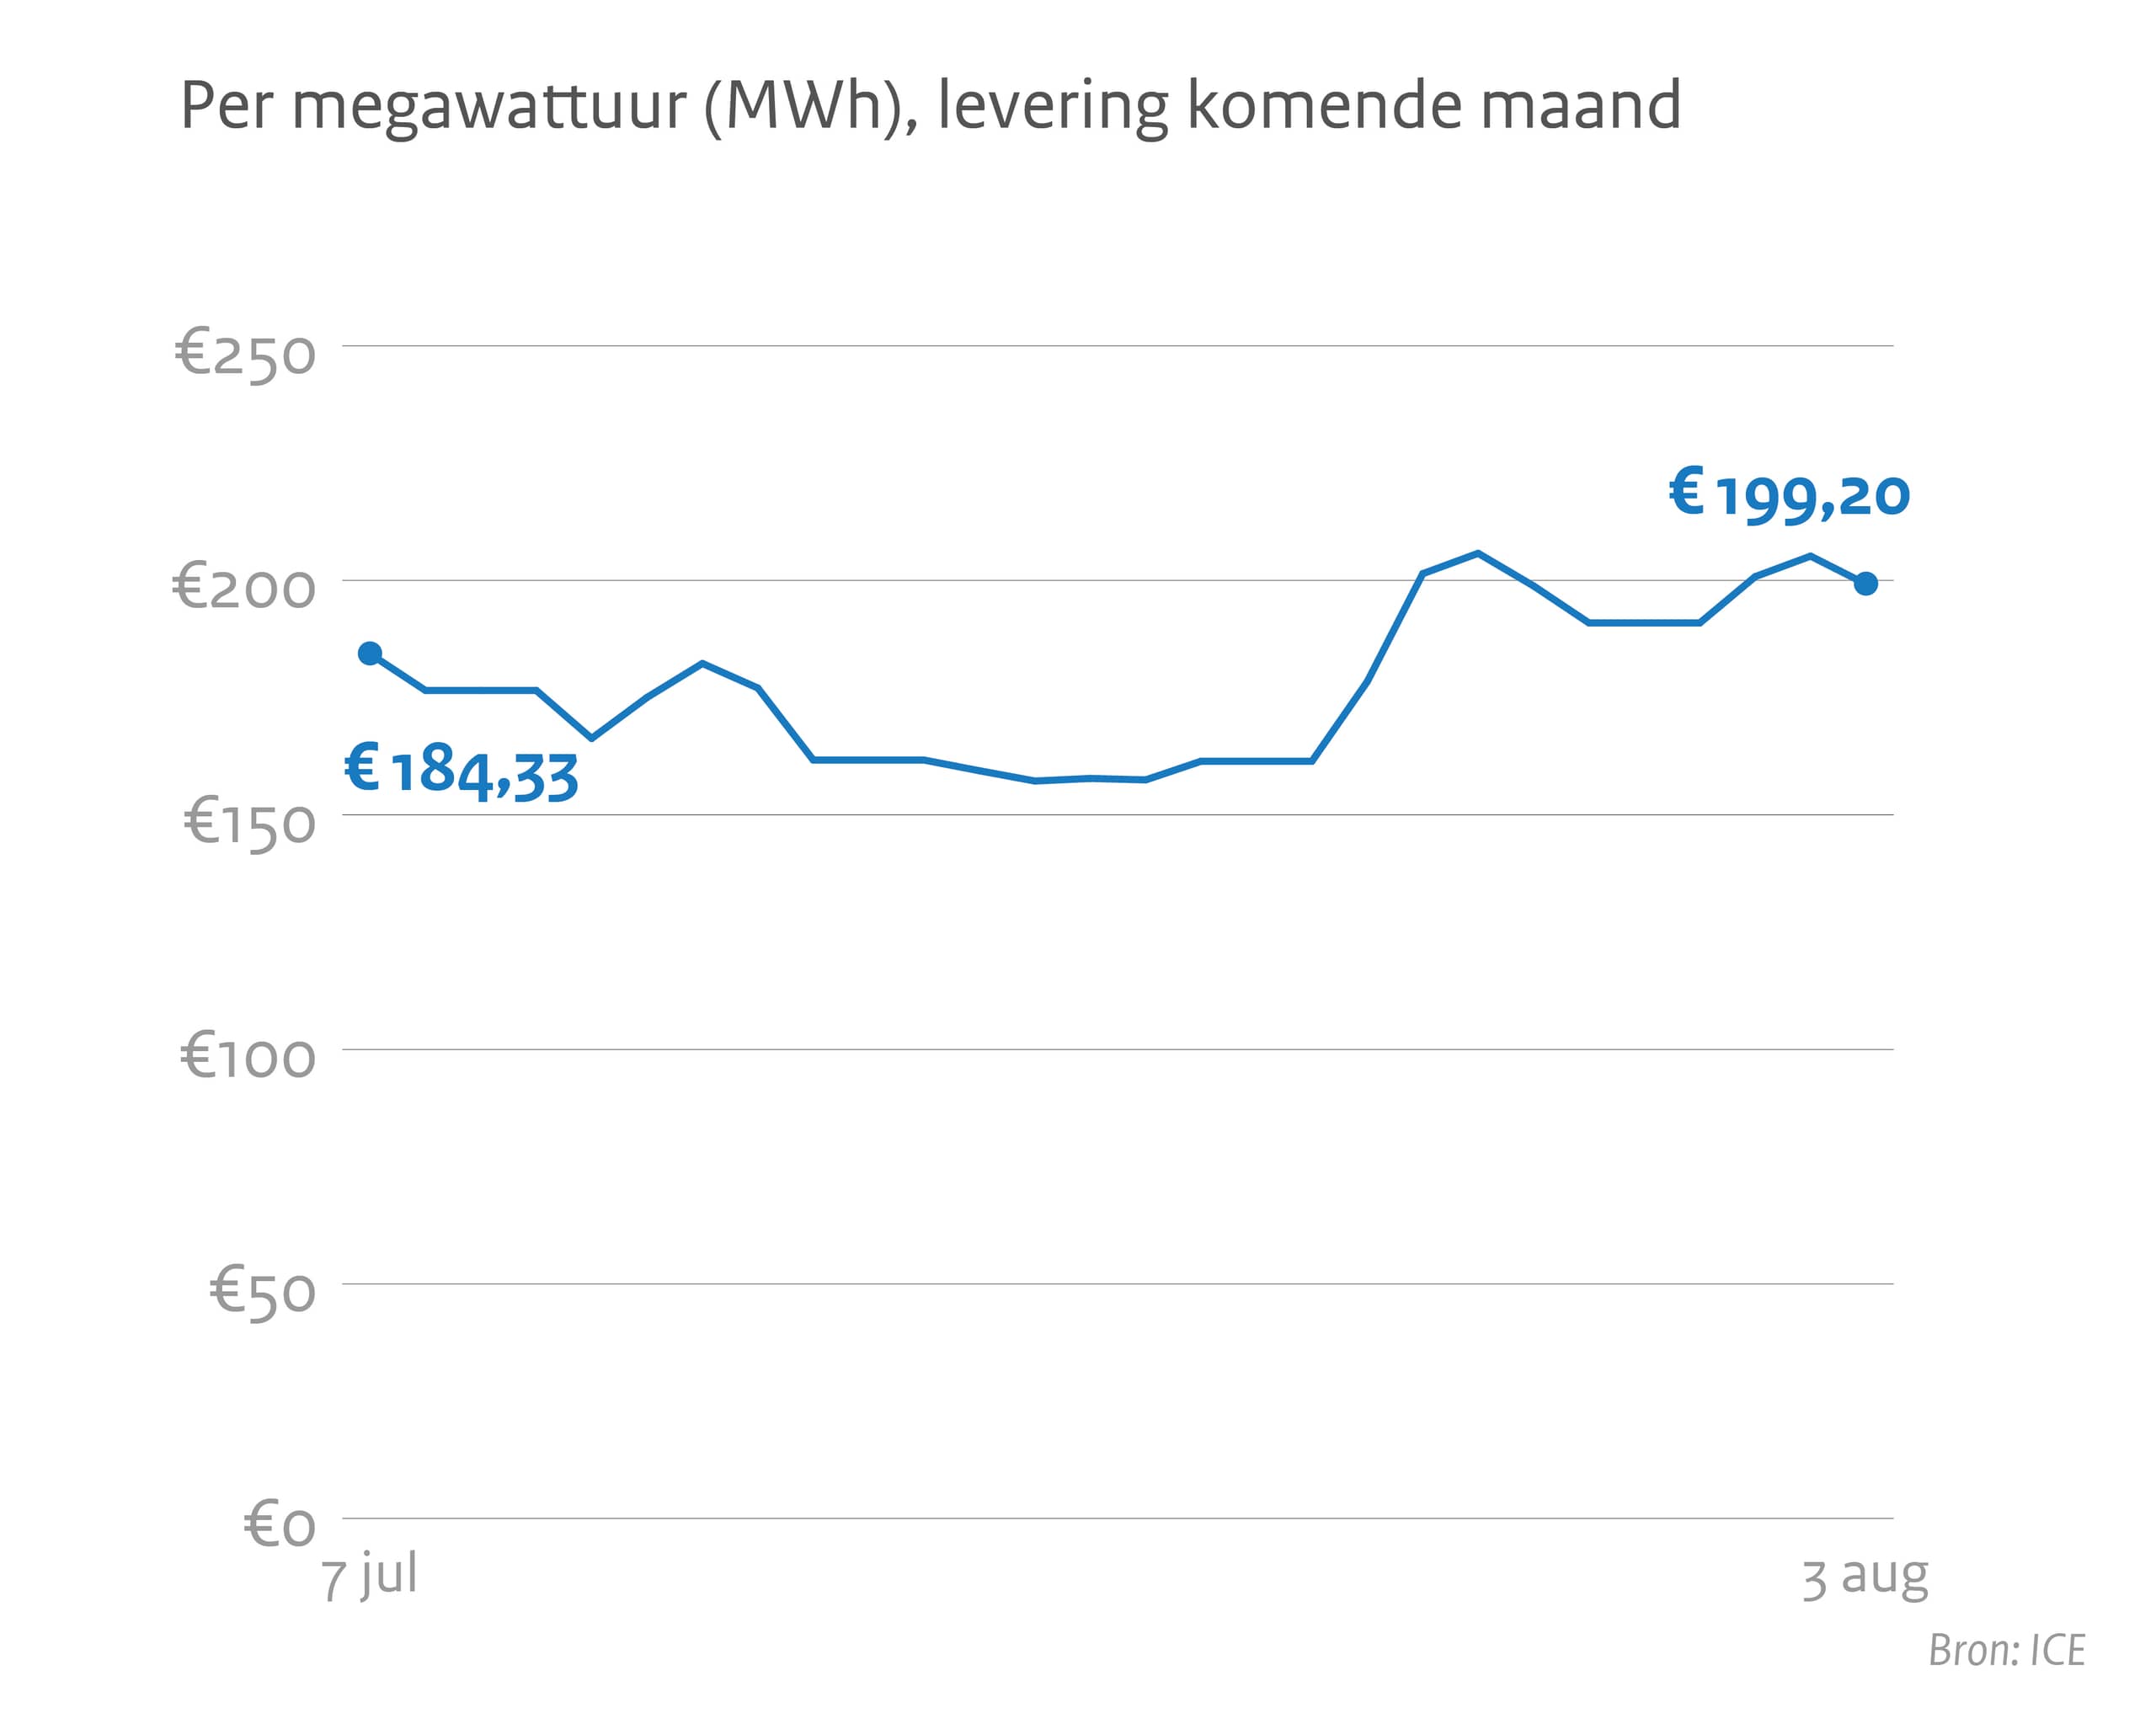
| Gasprijs in € | |
|---|---|
| 7 juli 2022 | 184,33 |
| 3 augustus 2022 | 199,20 |
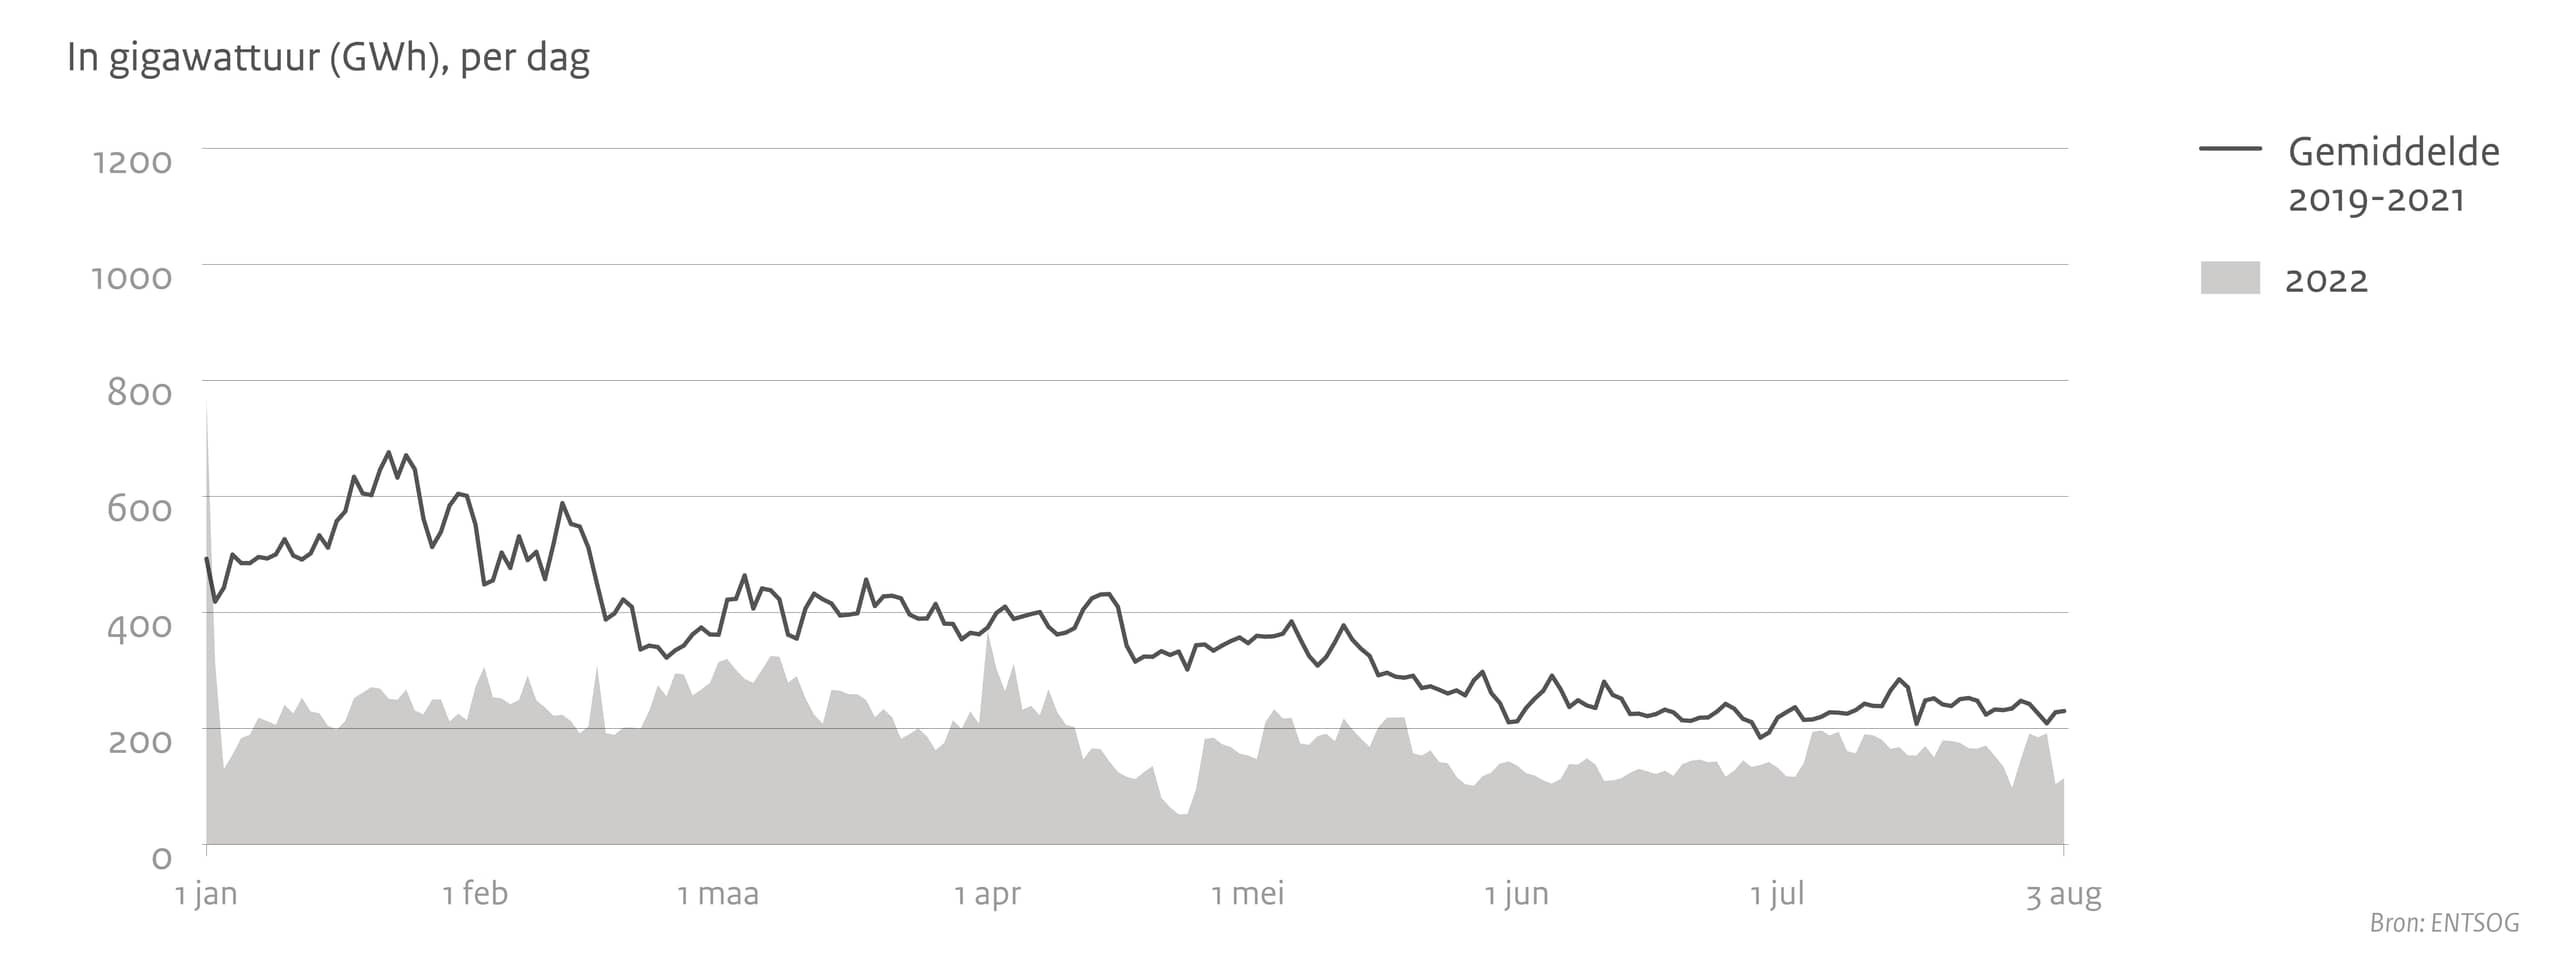
Gastransport van Nederland naar Duitsland
| 2022 | 2019 - 2021 | |
|---|---|---|
| 1 januari | 870,2 GWh | 730,54 GWh |
| 1 februari | 763,4 GWh | 863,2 GWh |
| 1 maart | 673,07 GWh | 791,63 GWh |
| 1 april | 857,48 GWh | 760,16 GWh |
| 1 mei | 770,91 GWh | 638,79 GWh |
| 1 juni | 660,56 GWh | 609,47 GWh |
| 1 juli | 818,04 GWh | 497,27 GWh |
| 3 augustus | 722,48 GWh | 397,14 GWh |
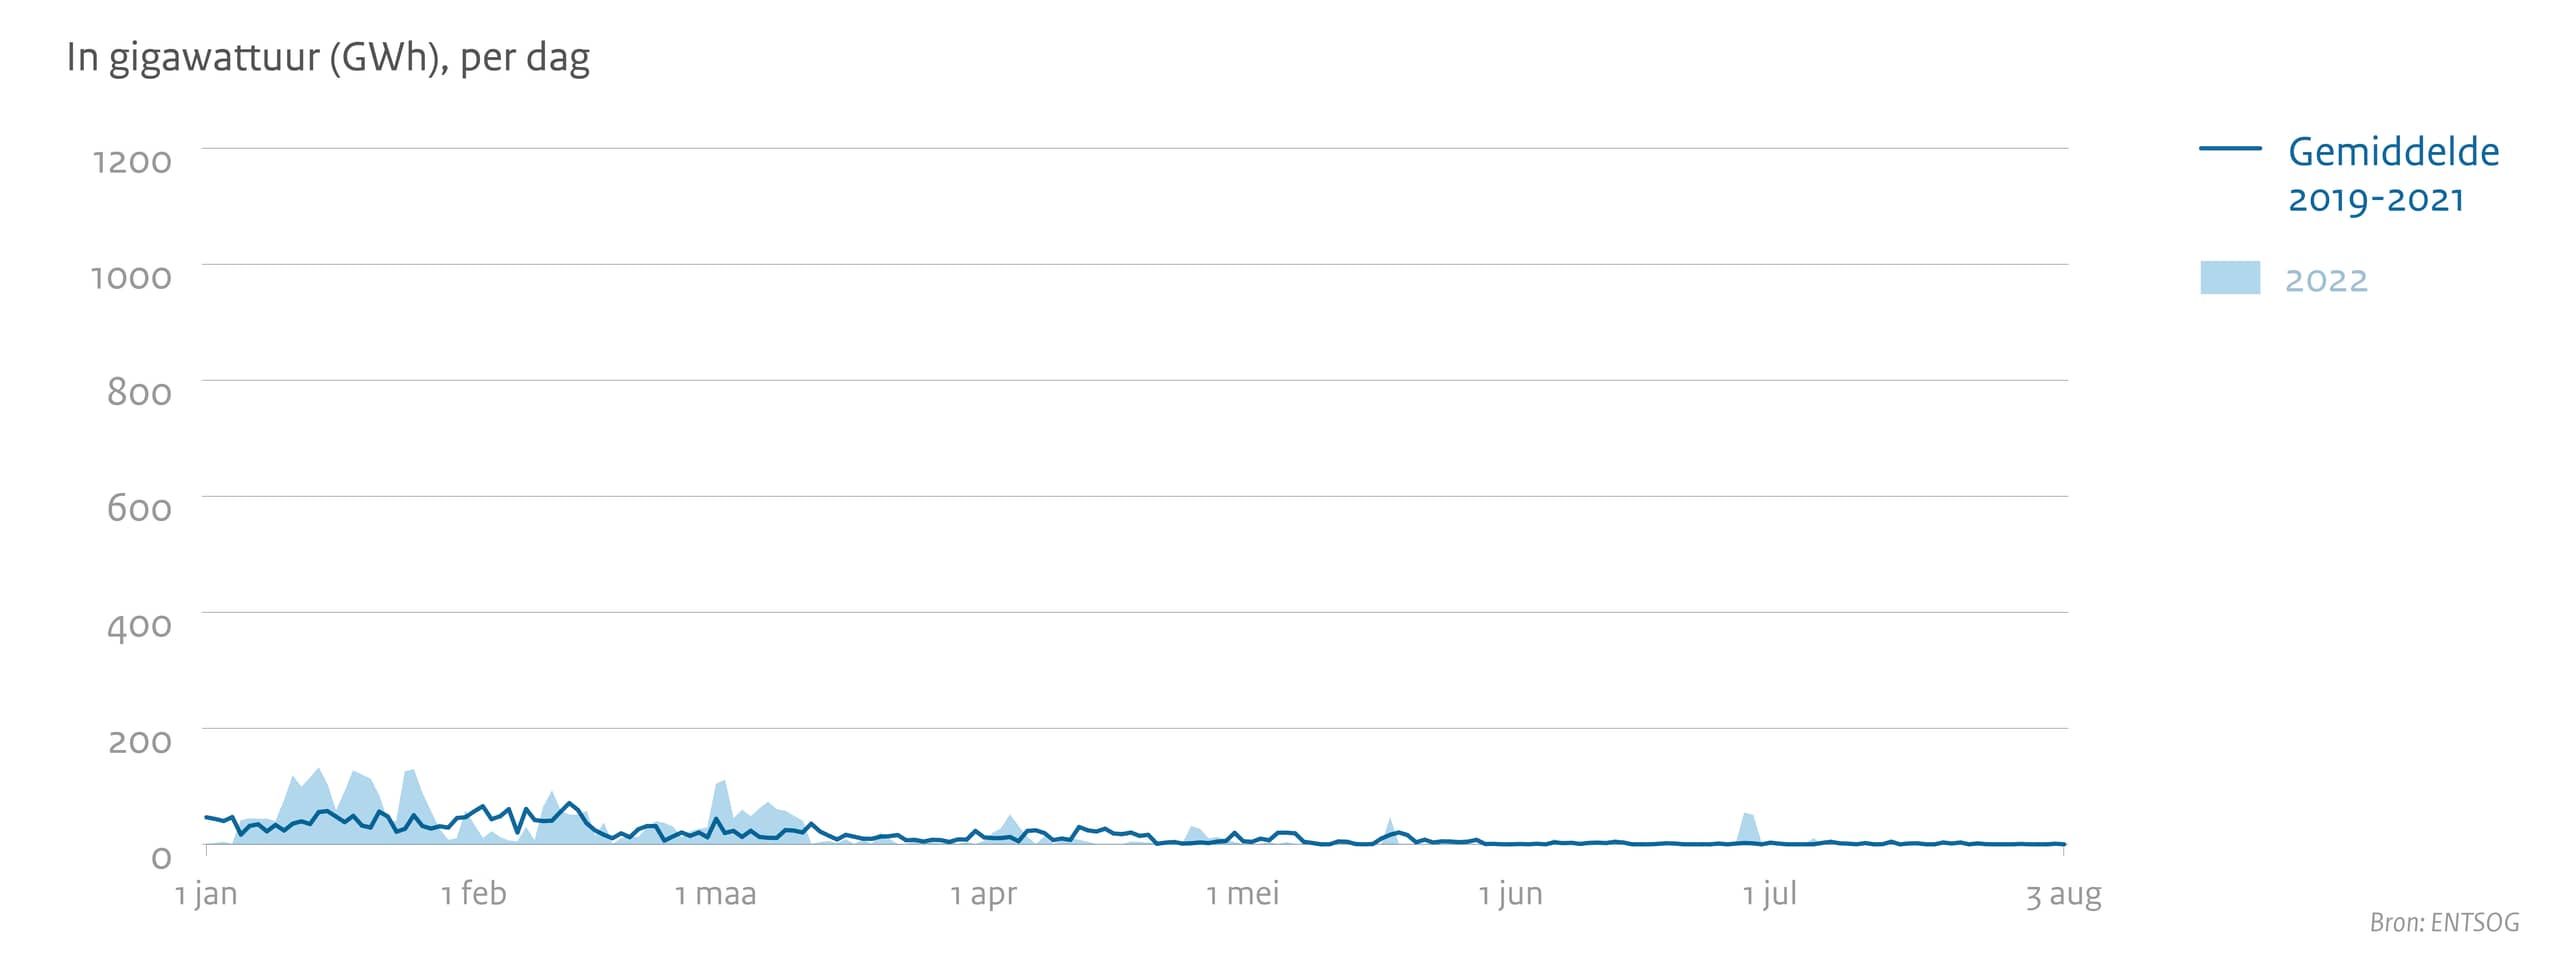
Gastransport van Duitsland naar Nederland
| 2022 | 2019 - 2021 | |
|---|---|---|
| 1 januari | 0,03 GWh | 46,58 GWh |
| 1 februari | 32,96 GWh | 56,87 GWh |
| 1 maart | 103,68 GWh | 43,00 GWh |
| 1 april | 5,59 GWh | 12,03 GWh |
| 1 mei | 0,0000185 GWh | 5,32 GWh |
| 1 juni | 0,0000395 GWh | 0,00655667 GWh |
| 1 juli | 0,0016667 GWh | 2,84 GWh |
| 3 augustus | 0 GWh | 0,001 GWh |
Gastransport van Nederland naar België
| 2022 | 2019 - 2021 | |
|---|---|---|
| 1 januari | 768,04 GWh | 492,57 GWh |
| 1 februari | 272,14 GWh | 551,19 GWh |
| 1 maart | 314,67 GWh | 361,59 GWh |
| 1 april | 367,16 GWh | 374,17 GWh |
| 1 mei | 153,22 GWh | 347,07 GWh |
| 1 juni | 136,01 GWh | 212,33 GWh |
| 1 juli | 132,31 GWh | 218,85 GWh |
| 3 augustus | 114,26 GWh | 230,13 GWh |
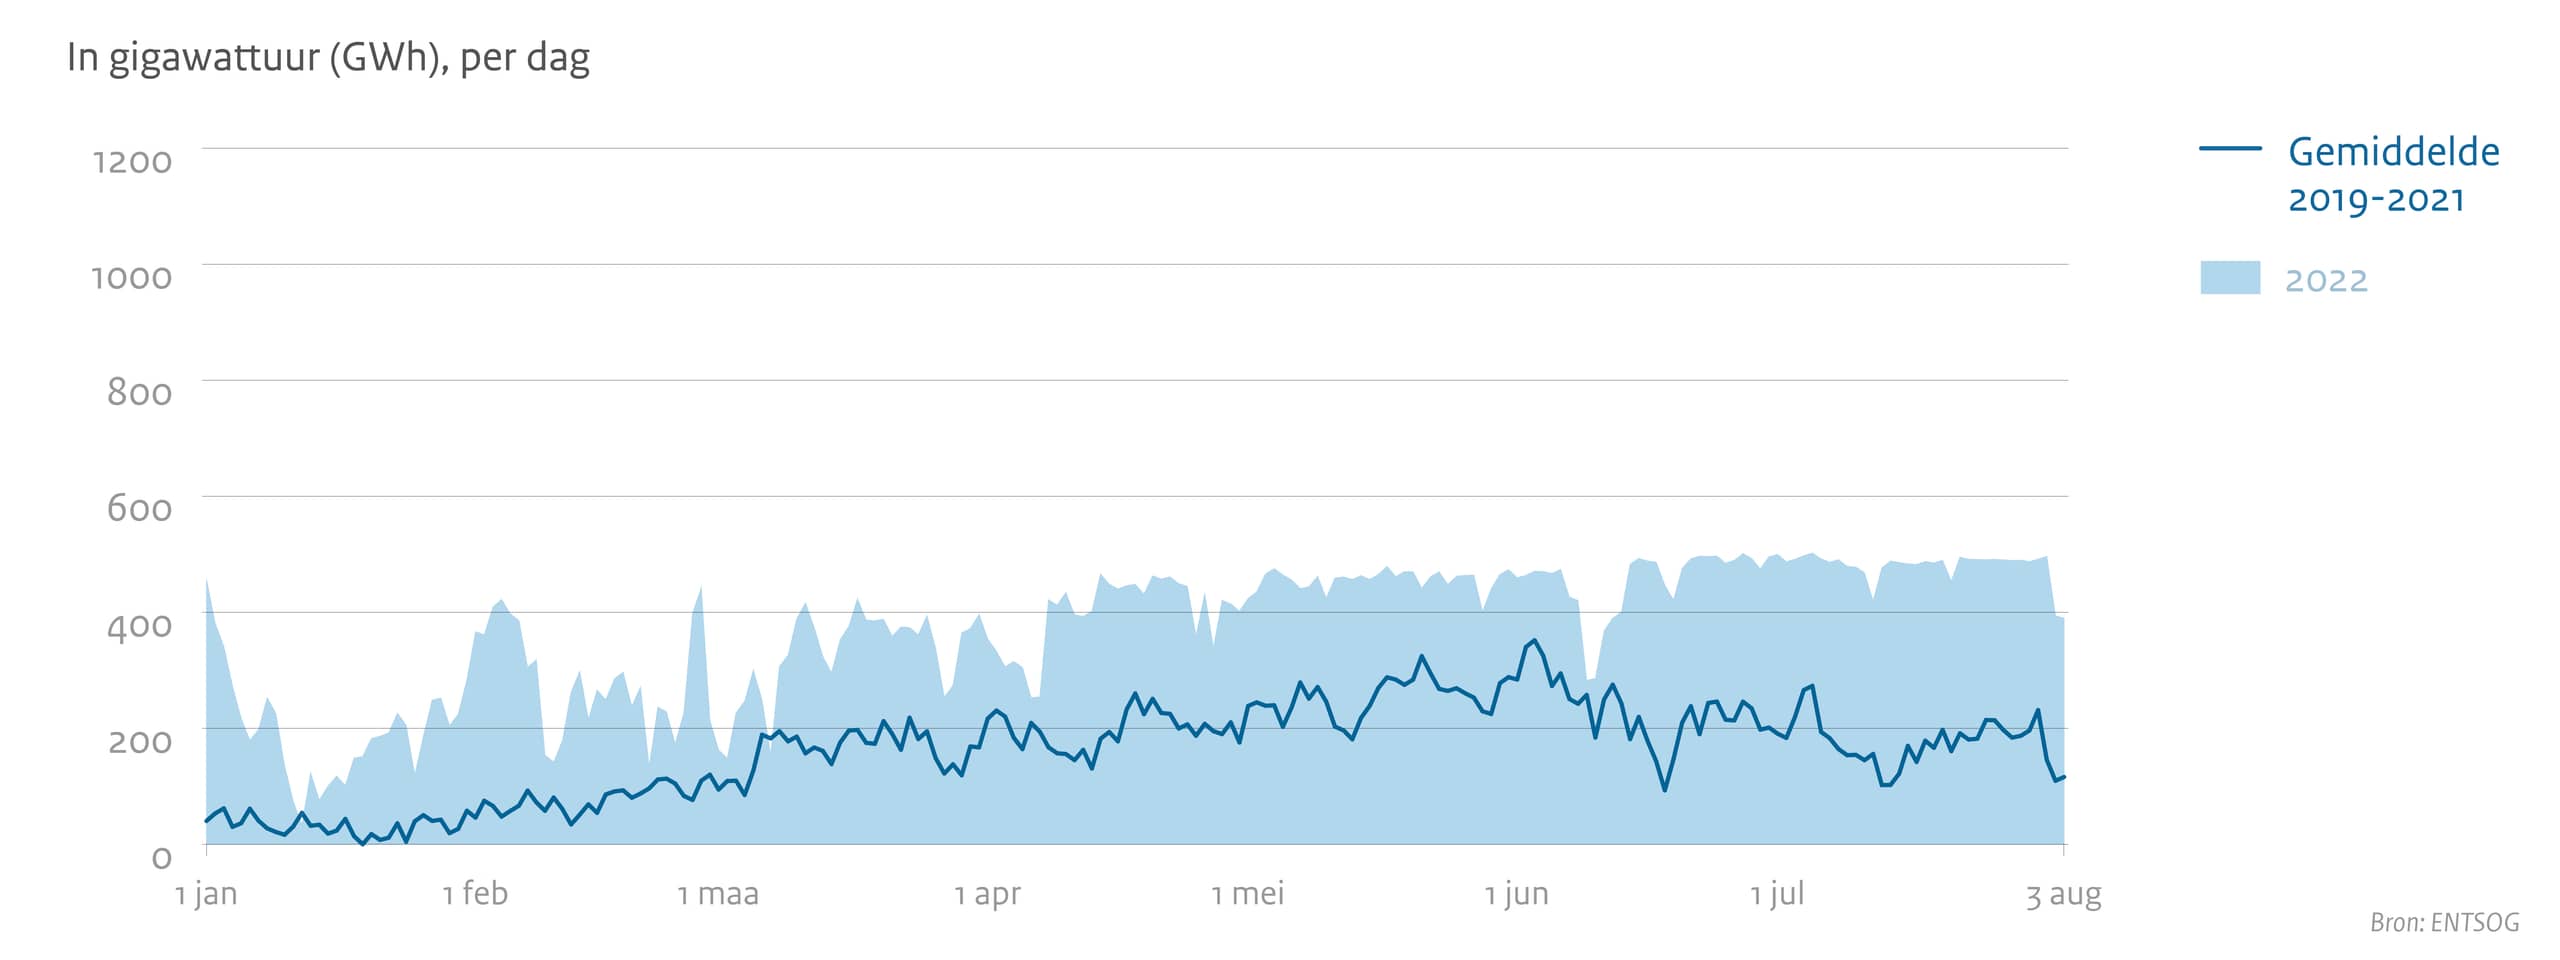
Gastransport van België naar Nederland
| 2022 | 2019 - 2021 | |
|---|---|---|
| 1 januari | 457 GWh | 40,20 GWh |
| 1 februari | 366,75 GWh | 46,03 GWh |
| 1 maart | 162,98 GWh | 94,40 GWh |
| 1 april | 354,17 GWh | 216,76 GWh |
| 1 mei | 423,94 GWh | 238,56 GWh |
| 1 juni | 459,68 GWh | 284,04 GWh |
| 1 juli | 499,80 GWh | 190,72 GWh |
| 3 augustus | 389,72 GWh | 116,10 GWh |
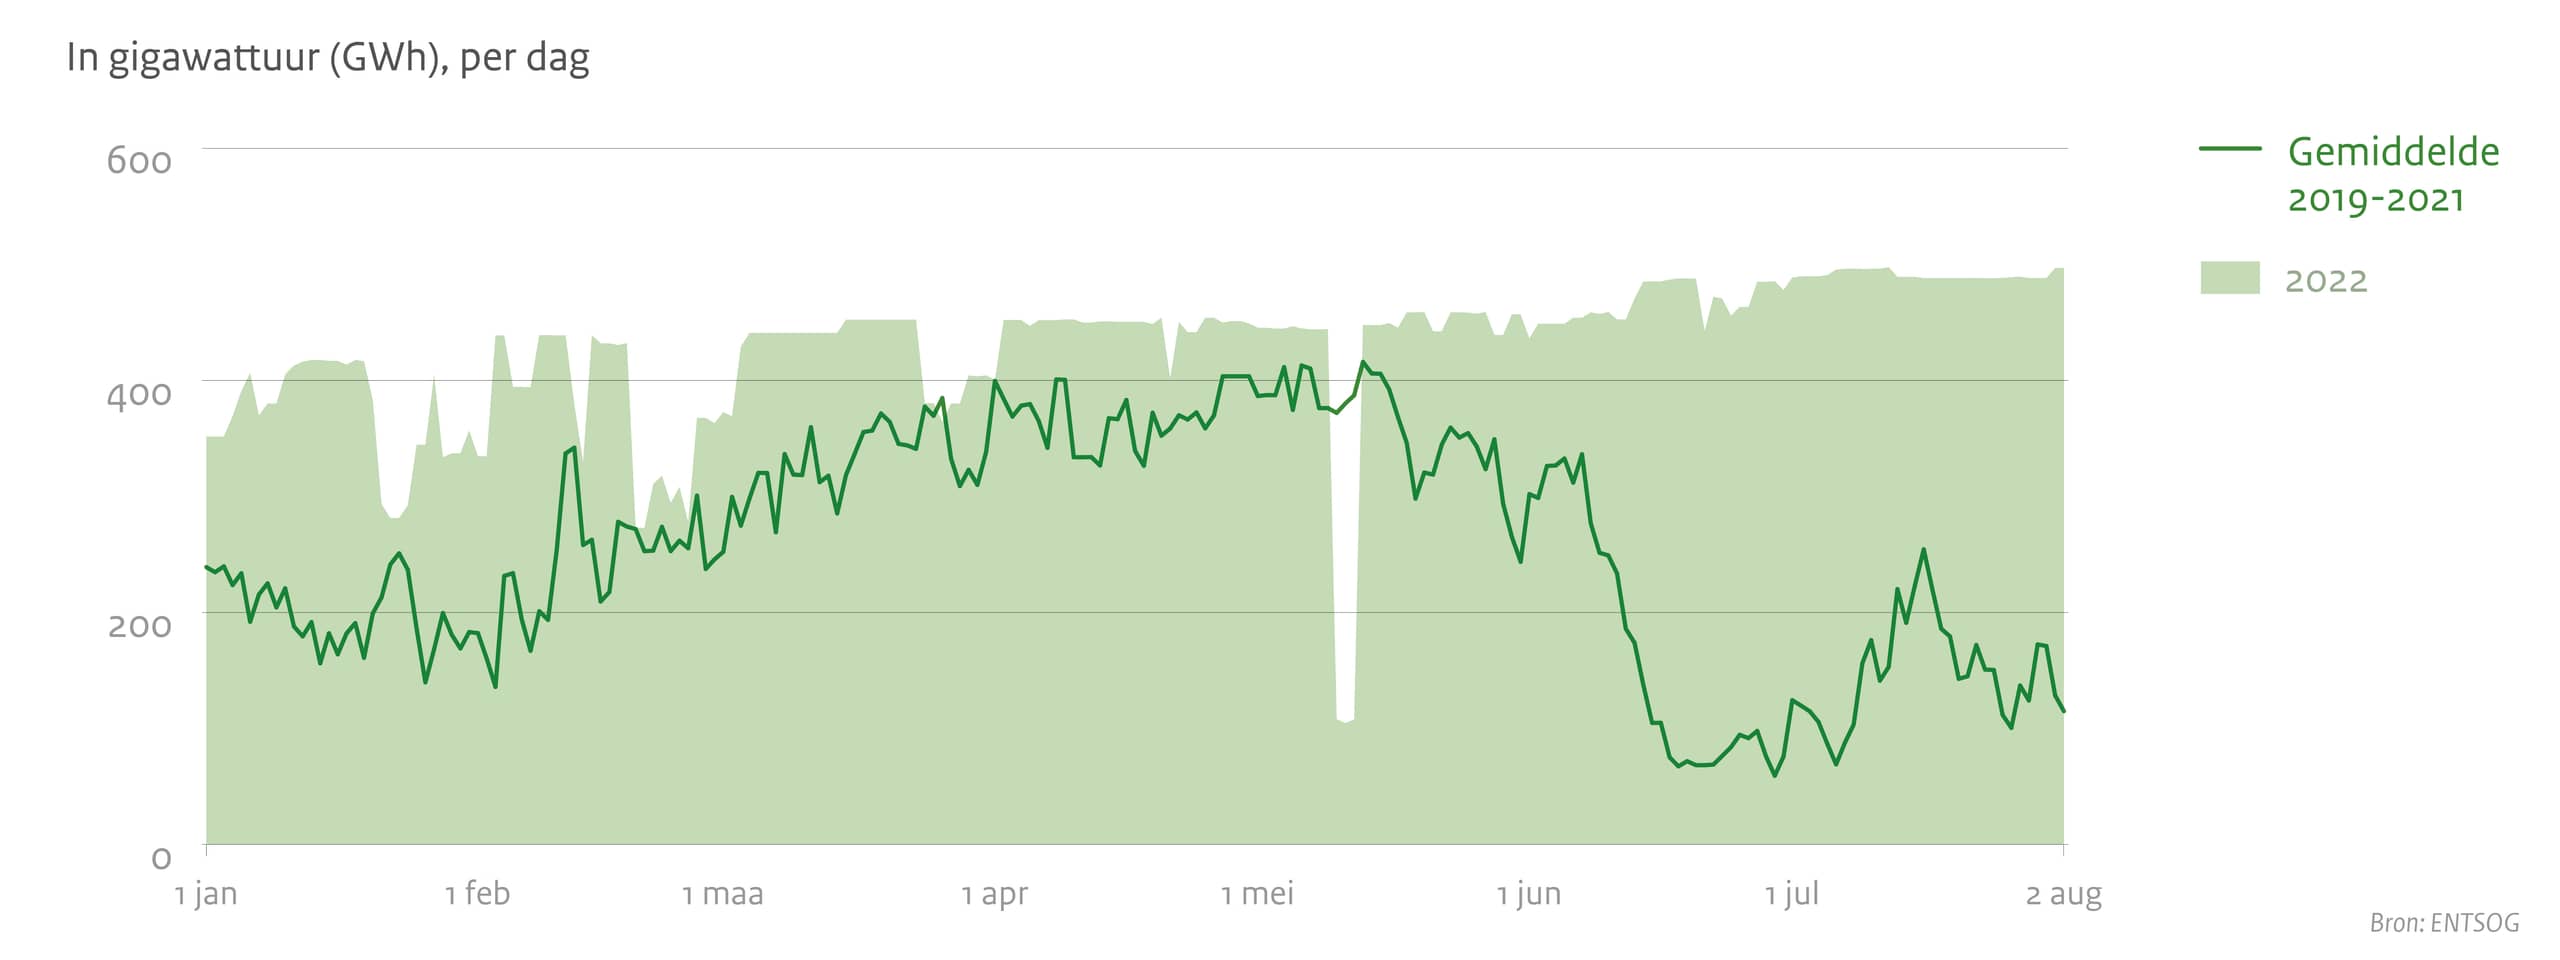
Aanvoer LNG naar Nederland
| 2022 | 2019 - 2021 | |
|---|---|---|
| 1 januari | 351,6 GWh | 239,1 GWh |
| 1 februari | 334,6 GWh | 182,2 GWh |
| 1 maart | 372,7 GWh | 252,27 GWh |
| 1 april | 400,5 GWh | 399,67 GWh |
| 1 mei | 445,4 GWh | 386,57 GWh |
| 1 juni | 436,3 GWh | 302,03 GWh |
| 1 juli | 302,03 GWh | 124,37 GWh |
| 2 augustus | 497 GWh | 114,93 GWh |
Toelichting
- Vulling gasopslagen gaat gestaag door.
- Levering Russisch gas ongewijzigd ten opzichte van vorige week.
- De gasprijs blijft hoog.
- Crisisniveau Vroegtijdige waarschuwing: De overheid ontvangt dagelijks vanuit de gassector gedetailleerde informatie over gasleveringen.
- Oproep aan bedrijven en huishoudens om energie te besparen. Kijk voor tips over energie besparen op zetookdeknopom.nl.
- Extra uitleg over deze update en de gebruikte cijfers staan in de factsheet Toelichting bij update gasleveringszekerheid.