Het kabinet houdt de situatie op de gasmarkt nauwlettend in de gaten. U leest hier actuele cijfers over de zekerheid van de gaslevering. Dit is de update van 7 oktober 2022.
- Het vullen van de gasopslagen gaat voorspoedig.
- Nordstream 1 en 2 zijn beschadigd door sabotage. NS1 was niet meer in gebruik. NS2 is nooit gebruikt.
- De gasprijs fluctueert sterk, maar is nog steeds hoog.
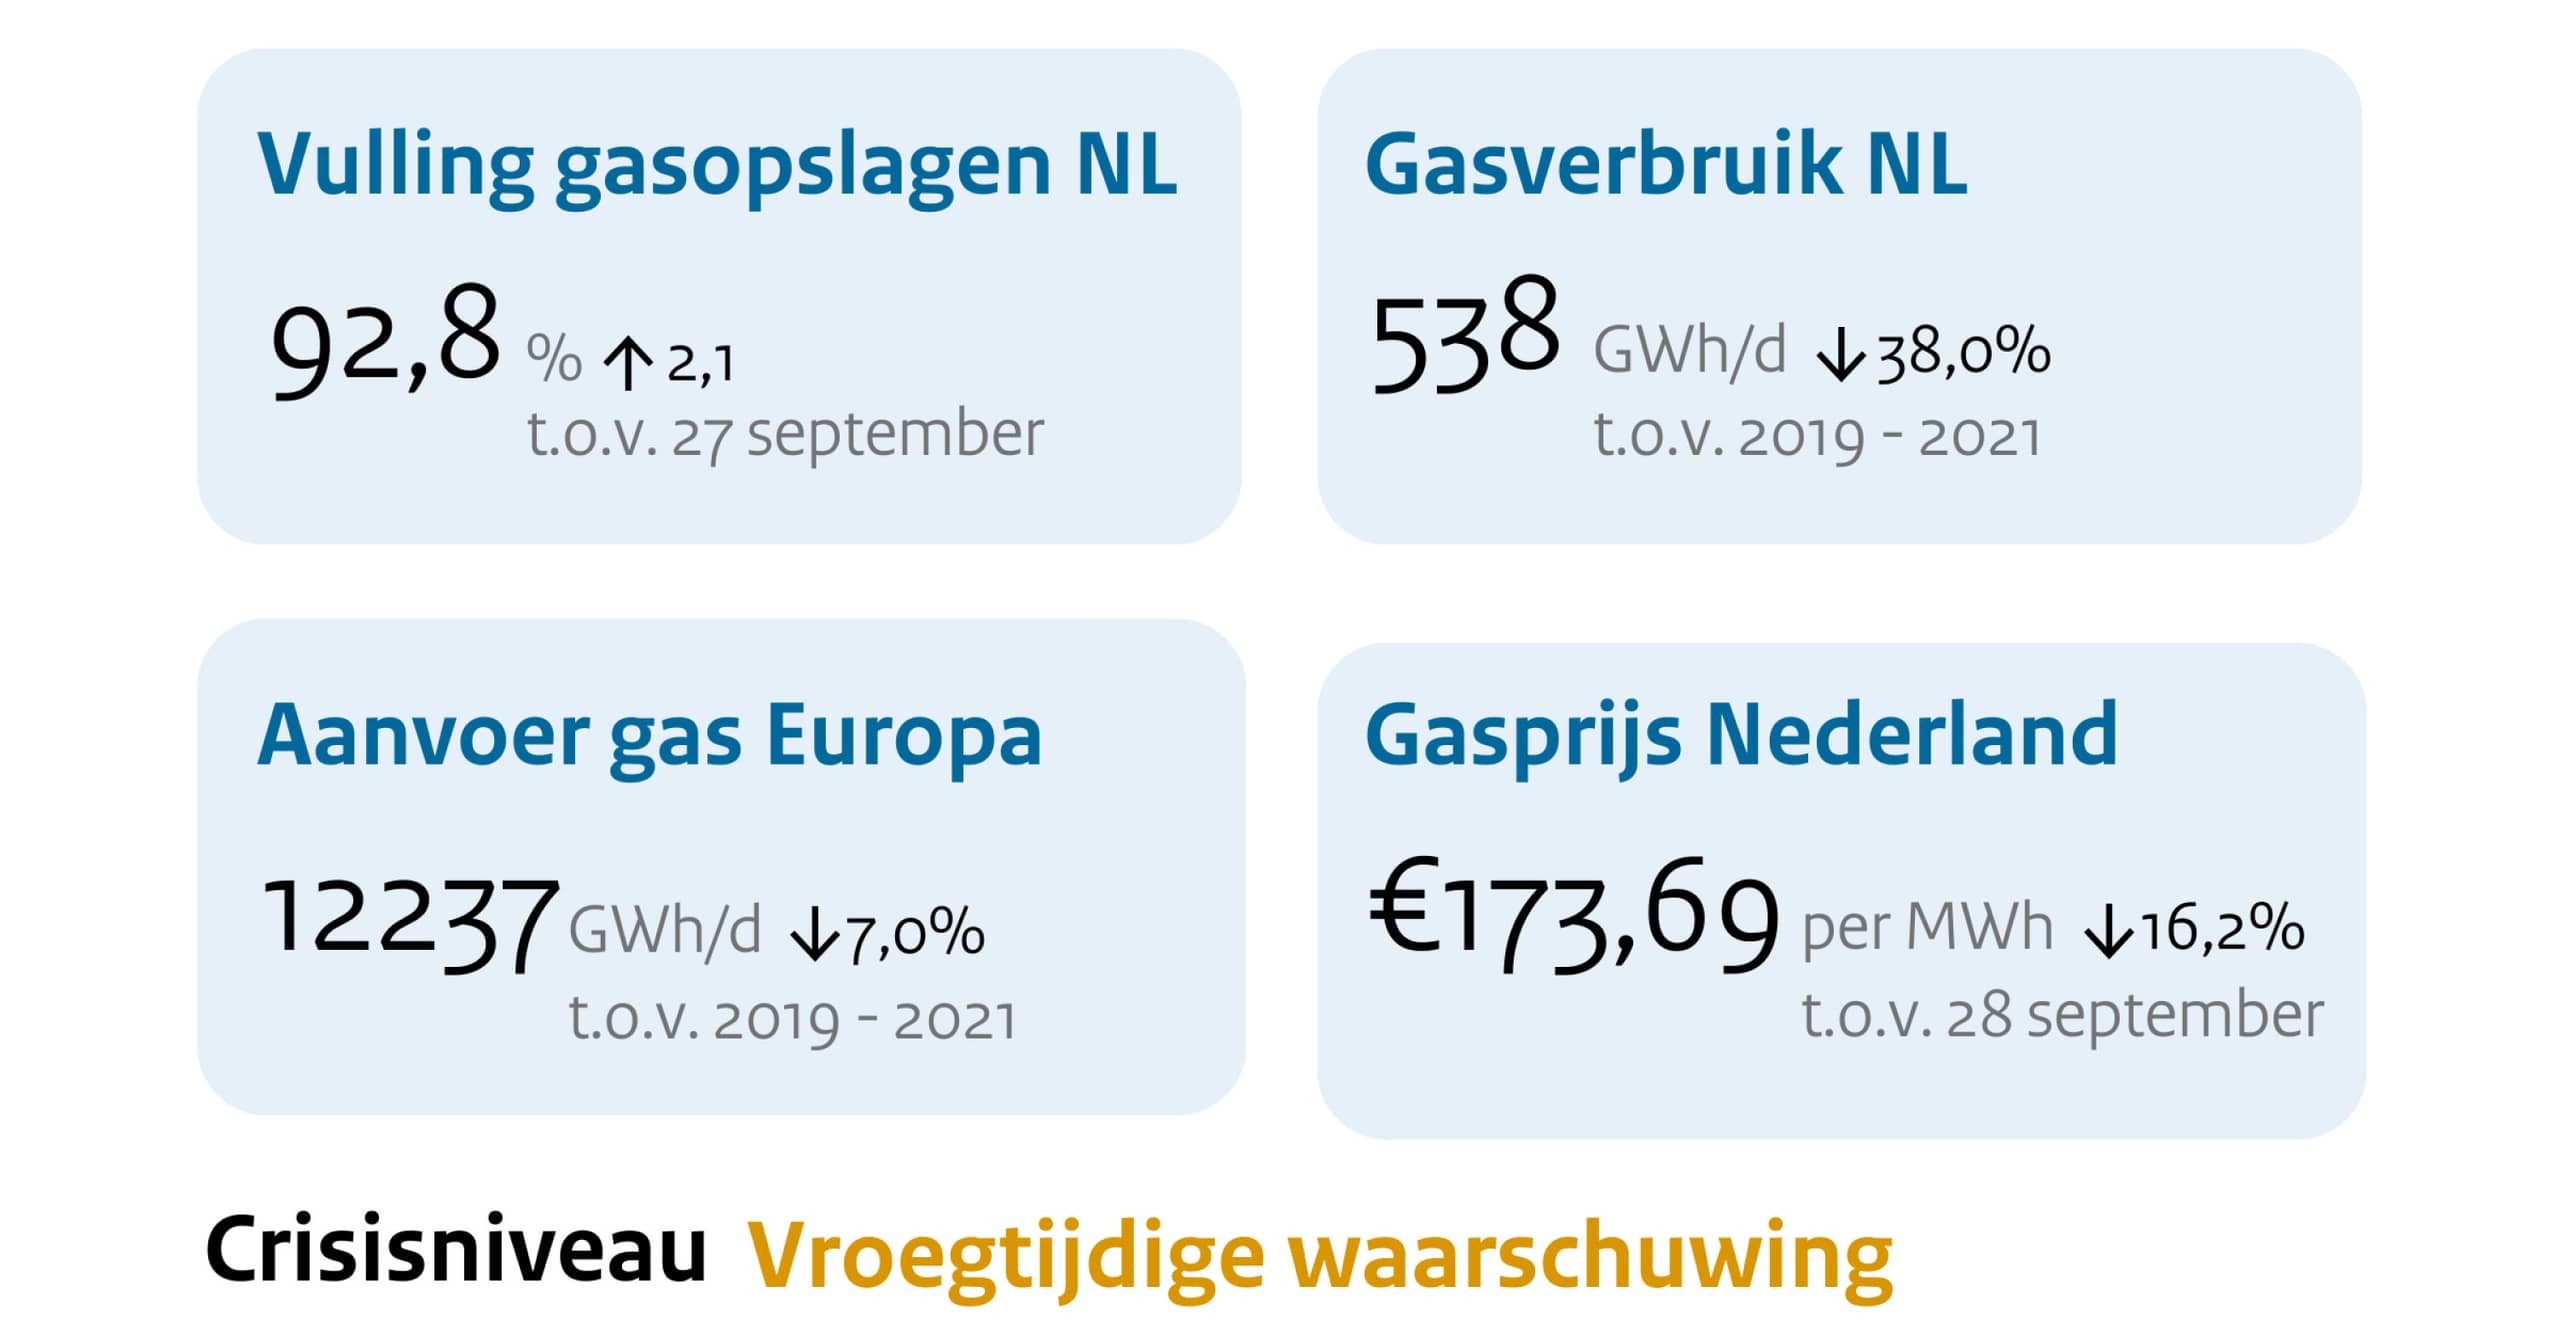
| Vulling gasopslagen | 92,8 % | Toename van 2,1 % t.o.v. 27 september |
|---|---|---|
| Gemiddeld gasverbruik in Nederland | 538 GWh per dag | Afname van 38,0 % t.o.v. 2019-2021 |
| Gemiddelde aanvoer gas Europa per dag | 12237 GWh per dag | Afname van 7,0 % t.o.v. 2019-2021 |
| Gasprijs Europa | € 173,69 per MWh | Afname van 16,2 % t.o.v. 28 september |
| Crisisniveau | Vroegtijdige waarschuwing |
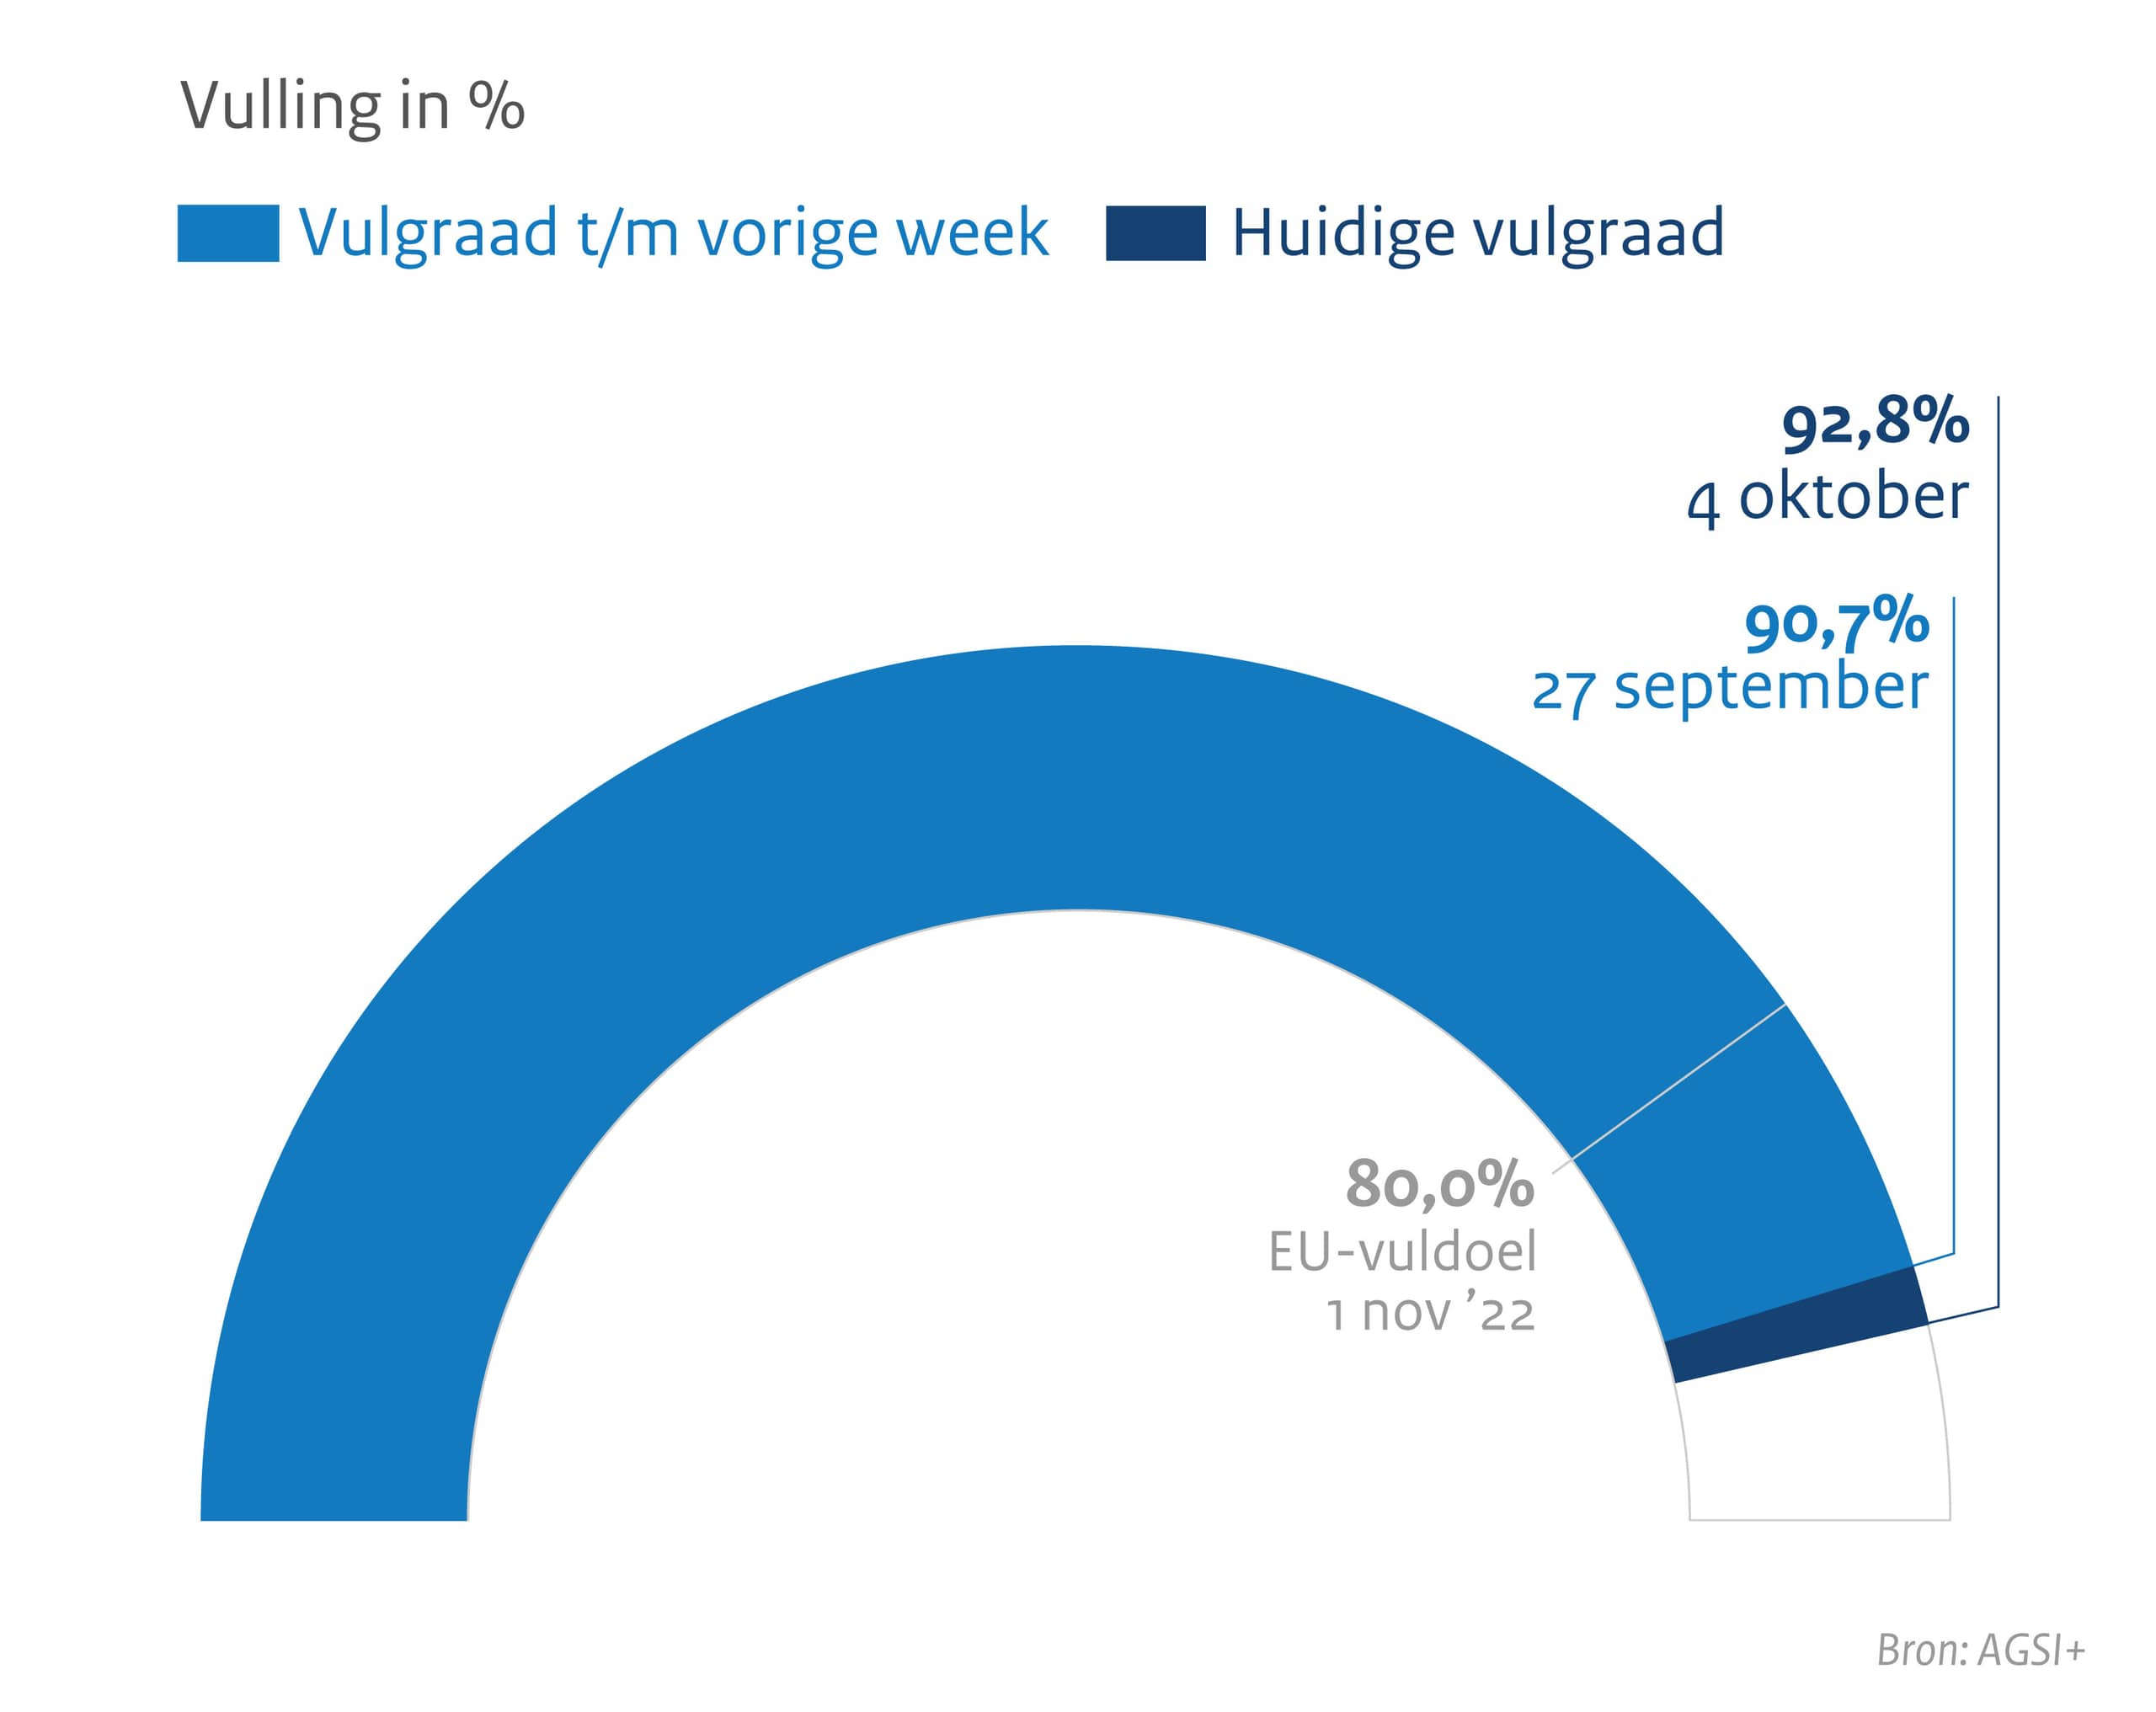
Vulling gasopslagen in Nederland
Data zoals bekend op 4 oktober 2022.
| 27 september | 4 oktober | ||
|---|---|---|---|
| Vulgraad in % | 90,7 % | 92,8% | |
| EU-vuldoel 1 november 2022 | 80 % |
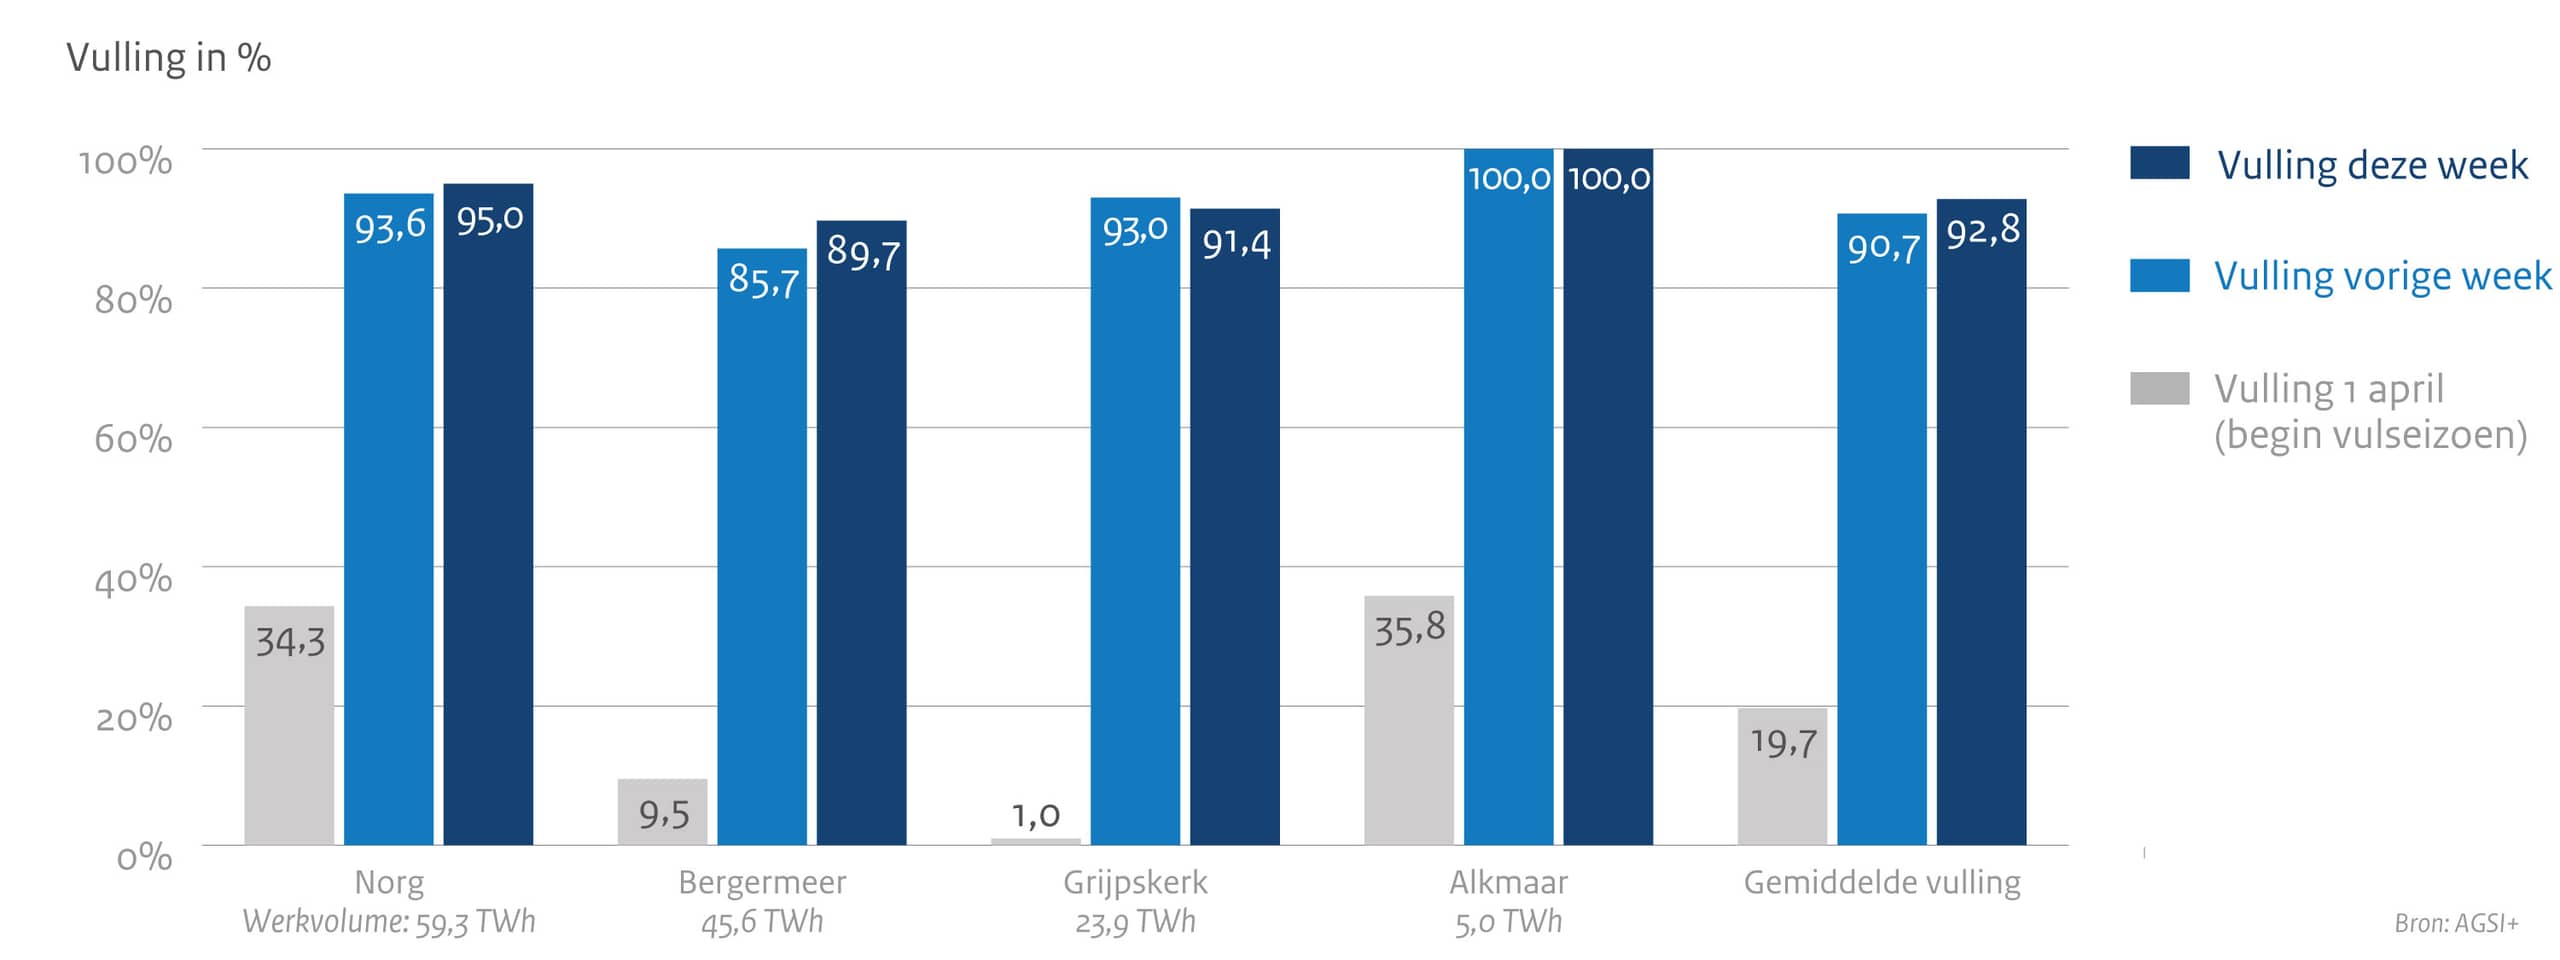
Vulling bergingen 2022
Vulling bergingen 2022
Bron: AGSI+
| Vulling in % |
Vulling 1 april (begin vulseizoen) | Vulling vorige week | Vulling deze week | Gemiddeld EU-vuldoel |
|---|---|---|---|---|
|
Norg Werkvolume 59,3 TWh | 34,3 % | 93,6 % | 95,0 % | |
|
Bergermeer Werkvolume 45,6 TWh | 9,5 % | 85,7 % | 89,7 % | |
|
Grijpskerk Werkvolume 23,9 TWh | 1,0 % | 93,0 % | 91,4 % | |
|
Alkmaar Werkvolume 5,0 TWh | 35,8 % | 100,0 % | 100,0 % | |
| Gemiddelde vulling | 19,7 % | 90,7 % | 92,8 % | 80 % |
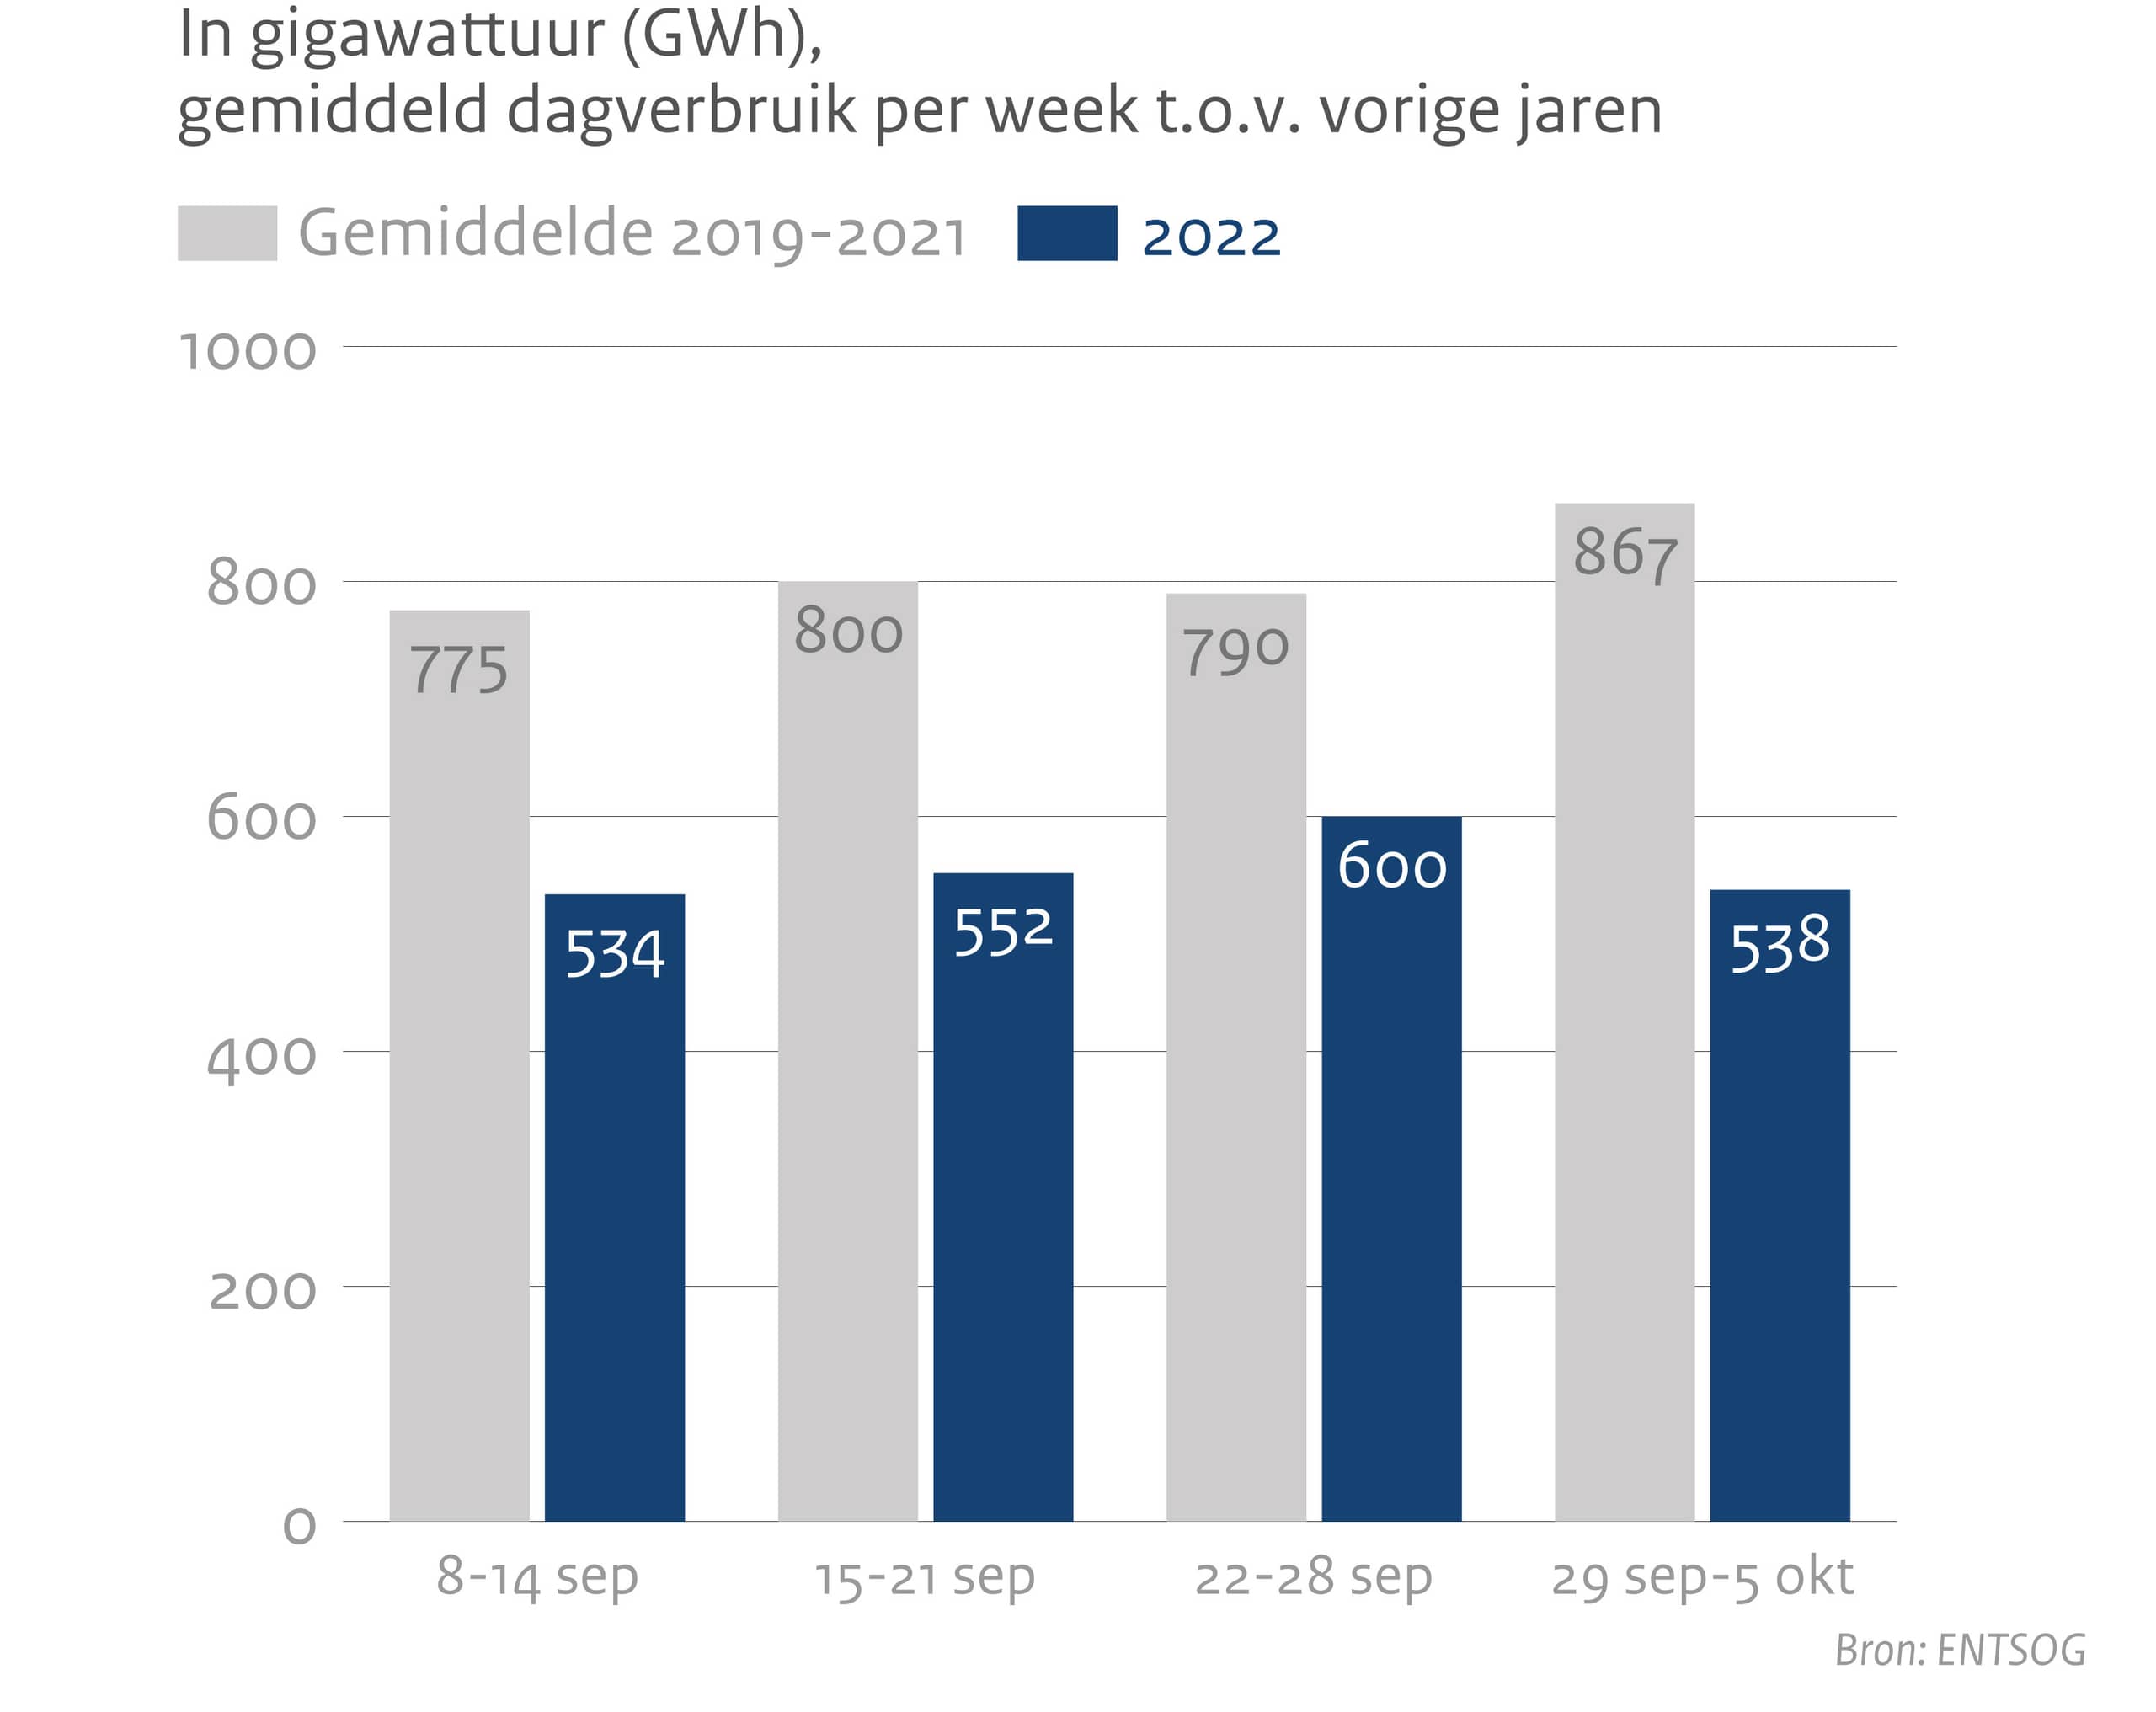
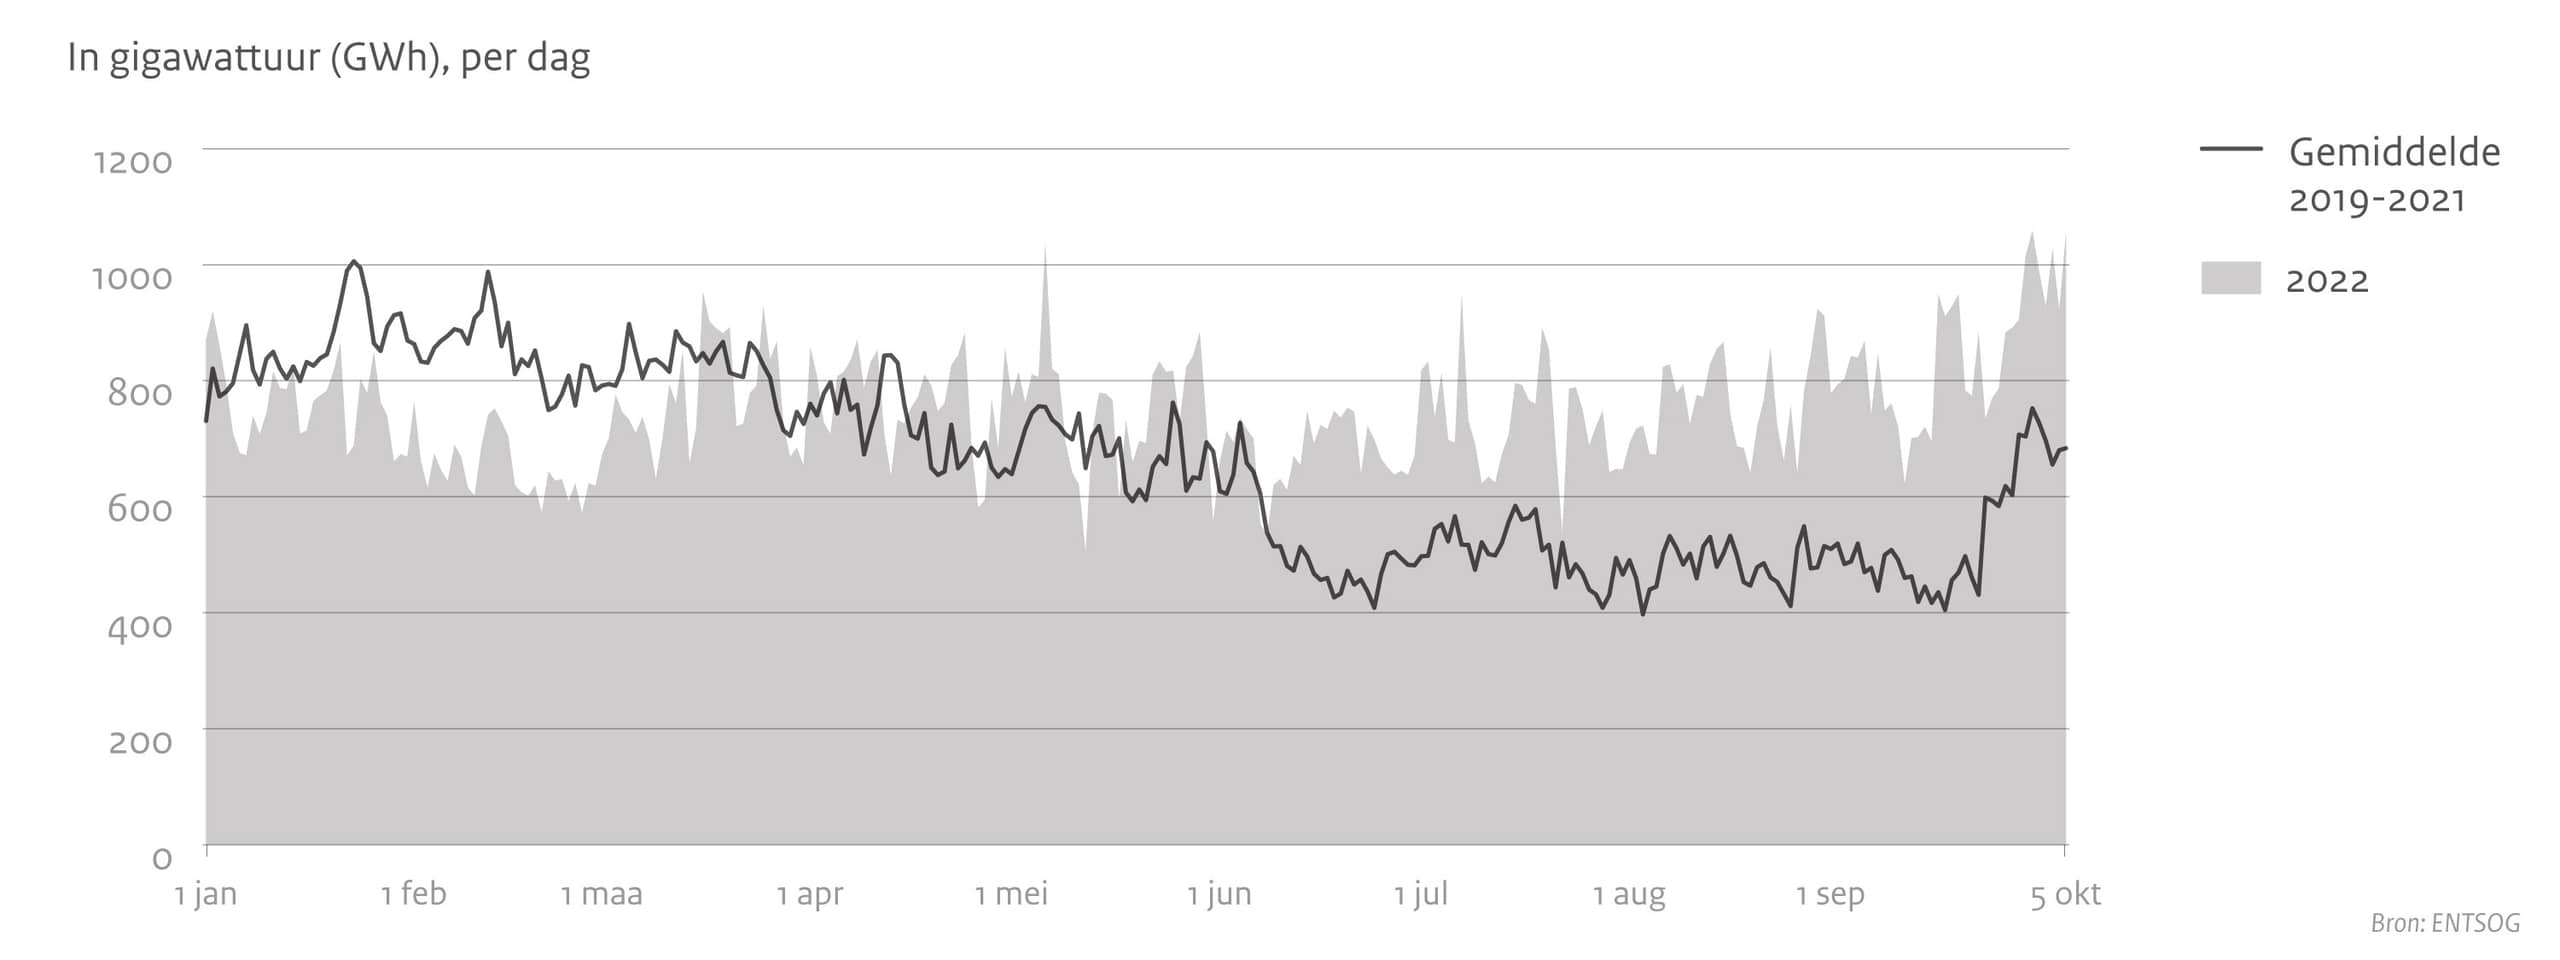
Gasverbruik in Nederland
Data zoals bekend op 5 oktober 2022.
| Gemiddelde 2019-2021 | 2022 | |
|---|---|---|
| 8 - 14 september | 775 GWh | 534 GWh |
| 15 - 21 september | 800 GWh | 552 GWh |
| 22 - 28 september | 790 GWh | 600 GWh |
| 29 sep - 5 okt | 867 GWh | 538 GWh |
Aanvoer gas voor Europa
Data zoals bekend op 5 oktober 2022.
Aanvoer tussen 8 september en 5 oktober in 2019-2021 en 2022
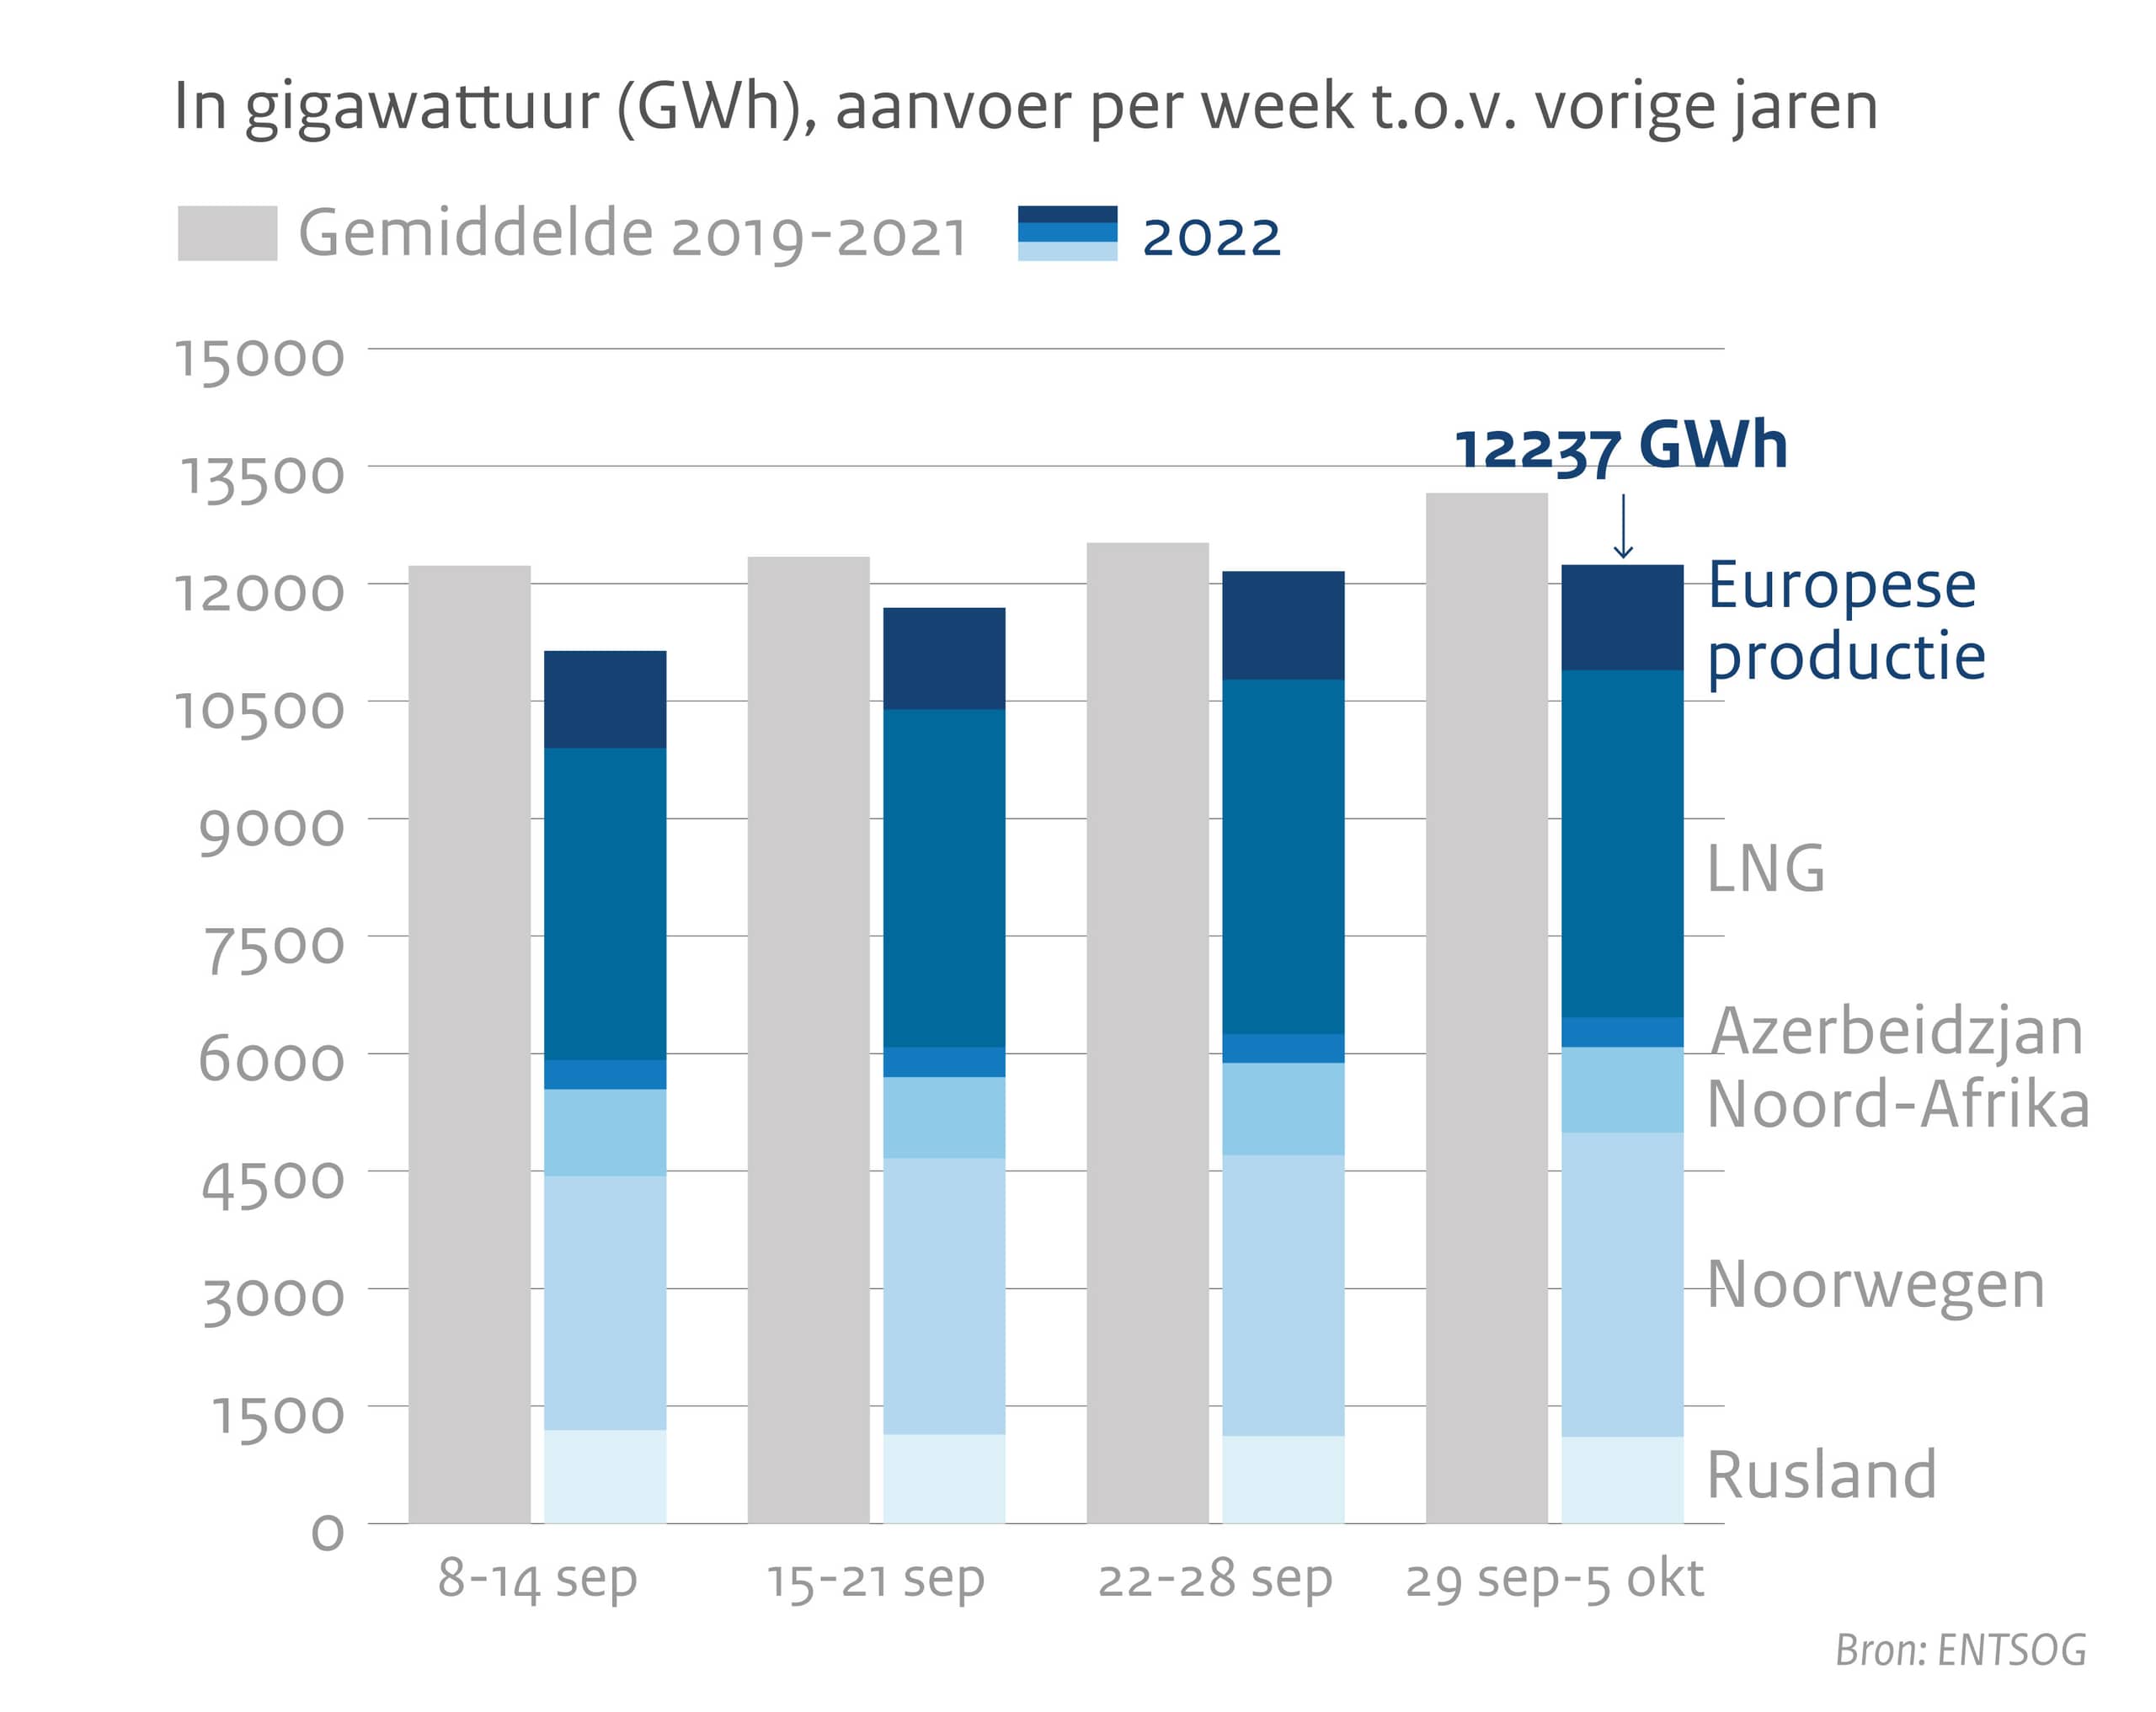
| 8 - 14 september | 15 - 21 september | 22 - 28 september | 29 sep - 5 okt | |
|---|---|---|---|---|
| Rusland | 1188,73 GWh | 1134,54 GWh | 1113,37 GWh | 1104,78 GWh |
| Noorwegen | 3244,79 GWh | 3526,59 GWh | 3586,80 GWh | 3883,26 GWh |
| Noord-Afrika | 1106,27 GWh | 1036,33 GWh | 1177,48 GWh | 1091,75 GWh |
|
Azerbeidzjan | 375,22 GWh | 378,53 GWh | 367,09 GWh | 377,19 GWh |
| Liquified Naturel GAS (LNG) | 3981,36 GWh | 4314,15 GWh | 4528,25 GWh | 4434,83 GWh |
| Europese productie | 1242,17 GWh | 1300,00 GWh | 1381,30 GWh | 1344,64 GWh |
2019-2021
Gemiddelde aanvoer van gas voor Europa per dag in 2019-2021
| 8 - 14 september | 15 - 21 september | 22 - 28 september | 29 sep - 5 okt | |
|---|---|---|---|---|
| Gemiddelde uit alle bronnen | 11138,54 GWh | 11690,15 GWh | 12154,29 GWh | 12236,45 GWh |
Aanvoer tussen 1 september 2021 - 5 oktober 2022
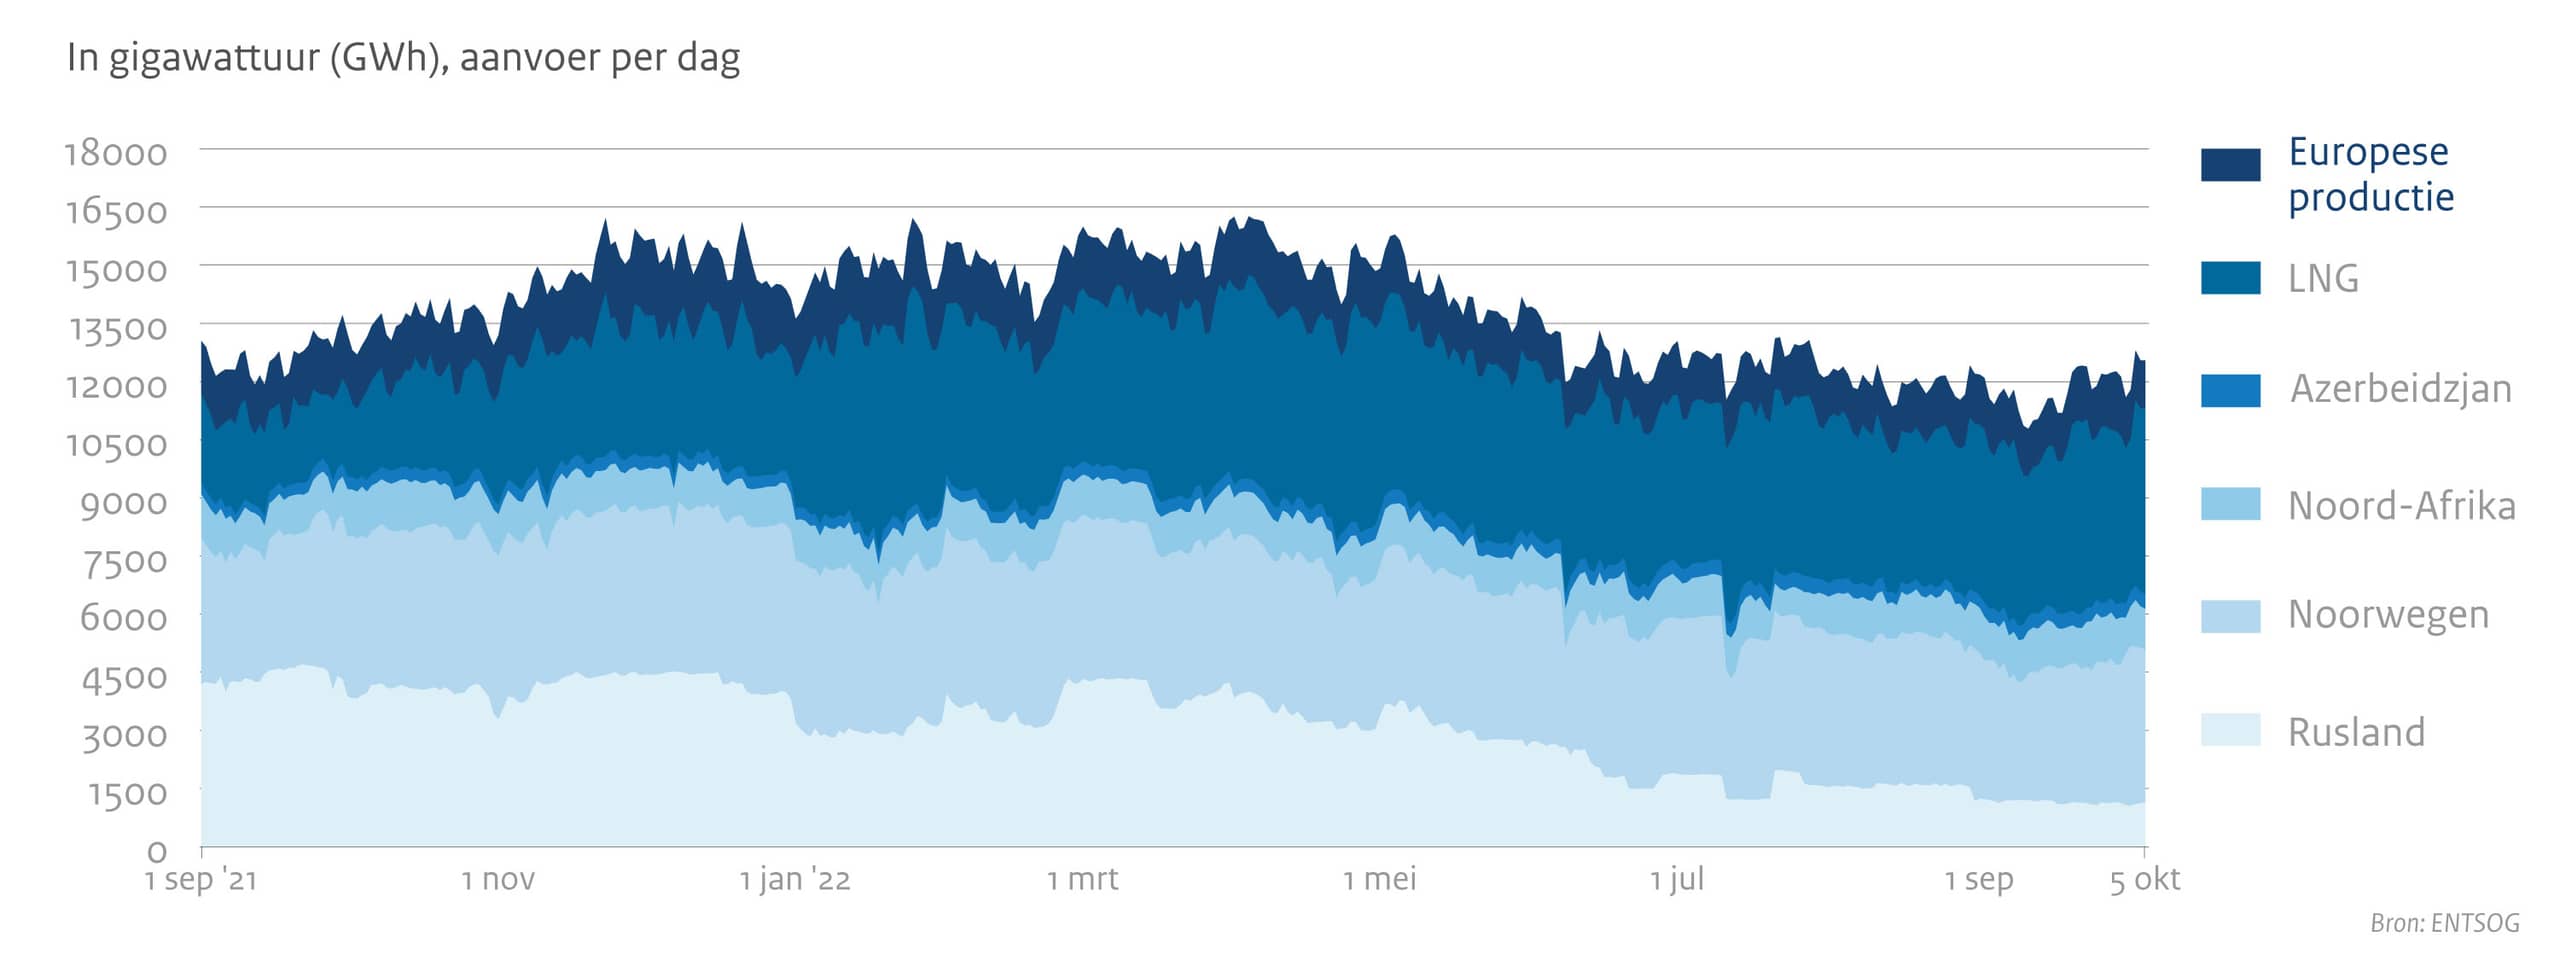
| Rusland | Noorwegen | Noord-Afrika | Azerbeidzjan | Liquified Naturel GAS (LNG) | Europese productie | |
|---|---|---|---|---|---|---|
| 1 september 2021 | 4195,76 GWh | 3770,47 GWh | 1124,5 GWh | 298,76 GWh | 2279,16 GWh | 1379,22 GWh |
| 1 november 2021 | 3283,91 GWh | 4216,11 GWh | 1067,07 GWh | 244,05 GWh | 2846,26 GWh | 1533,76 GWh |
| 1 januari 2022 | 3188,17 GWh | 4191,31 GWh | 1045,1 GWh | 314,72 GWh | 3348,21 GWh | 1524,56 GWh |
| 1 maart 2022 | 4320,03 GWh | 4248,31 GWh | 1028,22 GWh | 343,96 GWh | 4466,16 GWh | 1586,56 GWh |
| 1 mei 2022 | 3388,95 GWh | 3887,14 GWh | 1021,53 GWh | 366,96 GWh | 4883,64 GWh | 1372,08 GWh |
| 1 juli 2022 | 1878,00 GWh | 4002,02 GWh | 1034,49 GWh | 375,95 GWh | 4361,81 GWh | 1388,23 GWh |
| 1 september 2022 | 1235,90 GWh | 3756,47 GWh | 1168,12 GWh | 318,27 GWh | 4407,90 GWh | 1293,96 GWh |
| 5 oktober 2022 | 1135,06 GWh | 3941,13 GWh | 1057,63 GWh | 377,45 GWh | 4808,10 GWh | 1225,60 GWh |
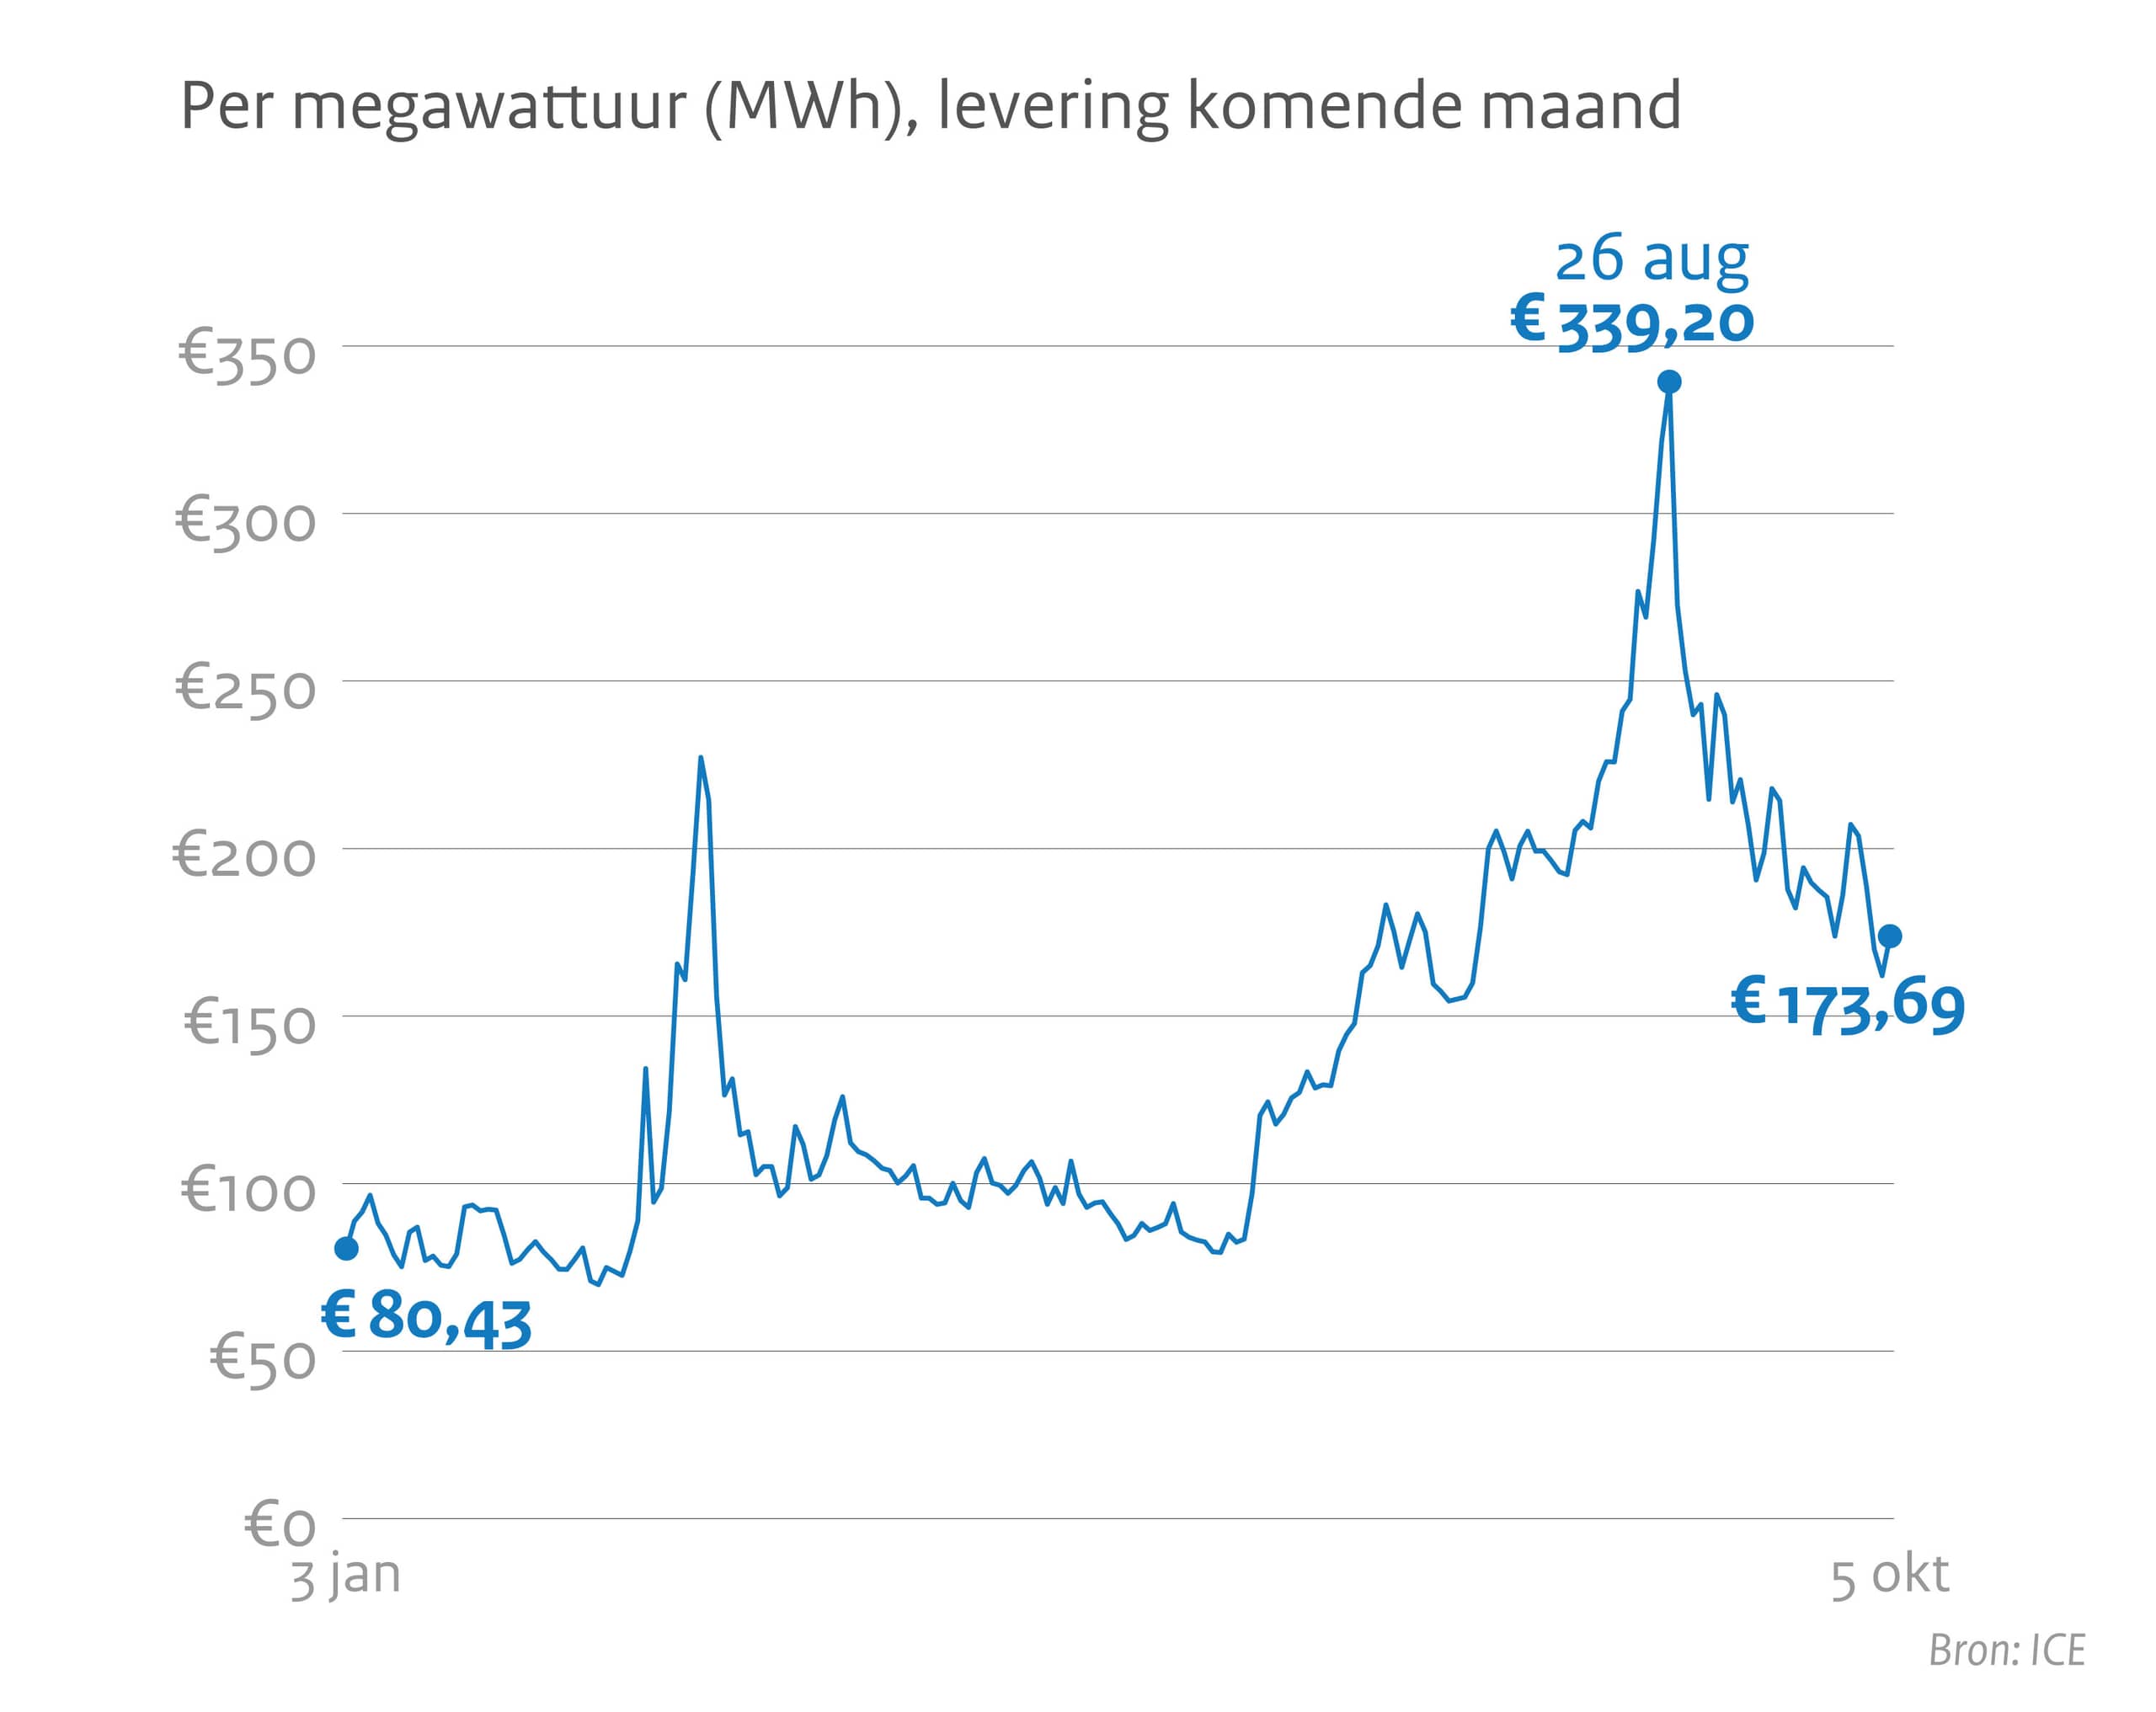
Gasprijs
Gasprijs tussen 3 januari en 5 oktober 2022 per megawattuur (MWh), levering komende maand
| Gasprijs in € | |
|---|---|
| 3 januari 2022 | 80,43 |
| 26 augustus 2022 | 339,20 |
| 5 oktober 2022 | 173,69 |
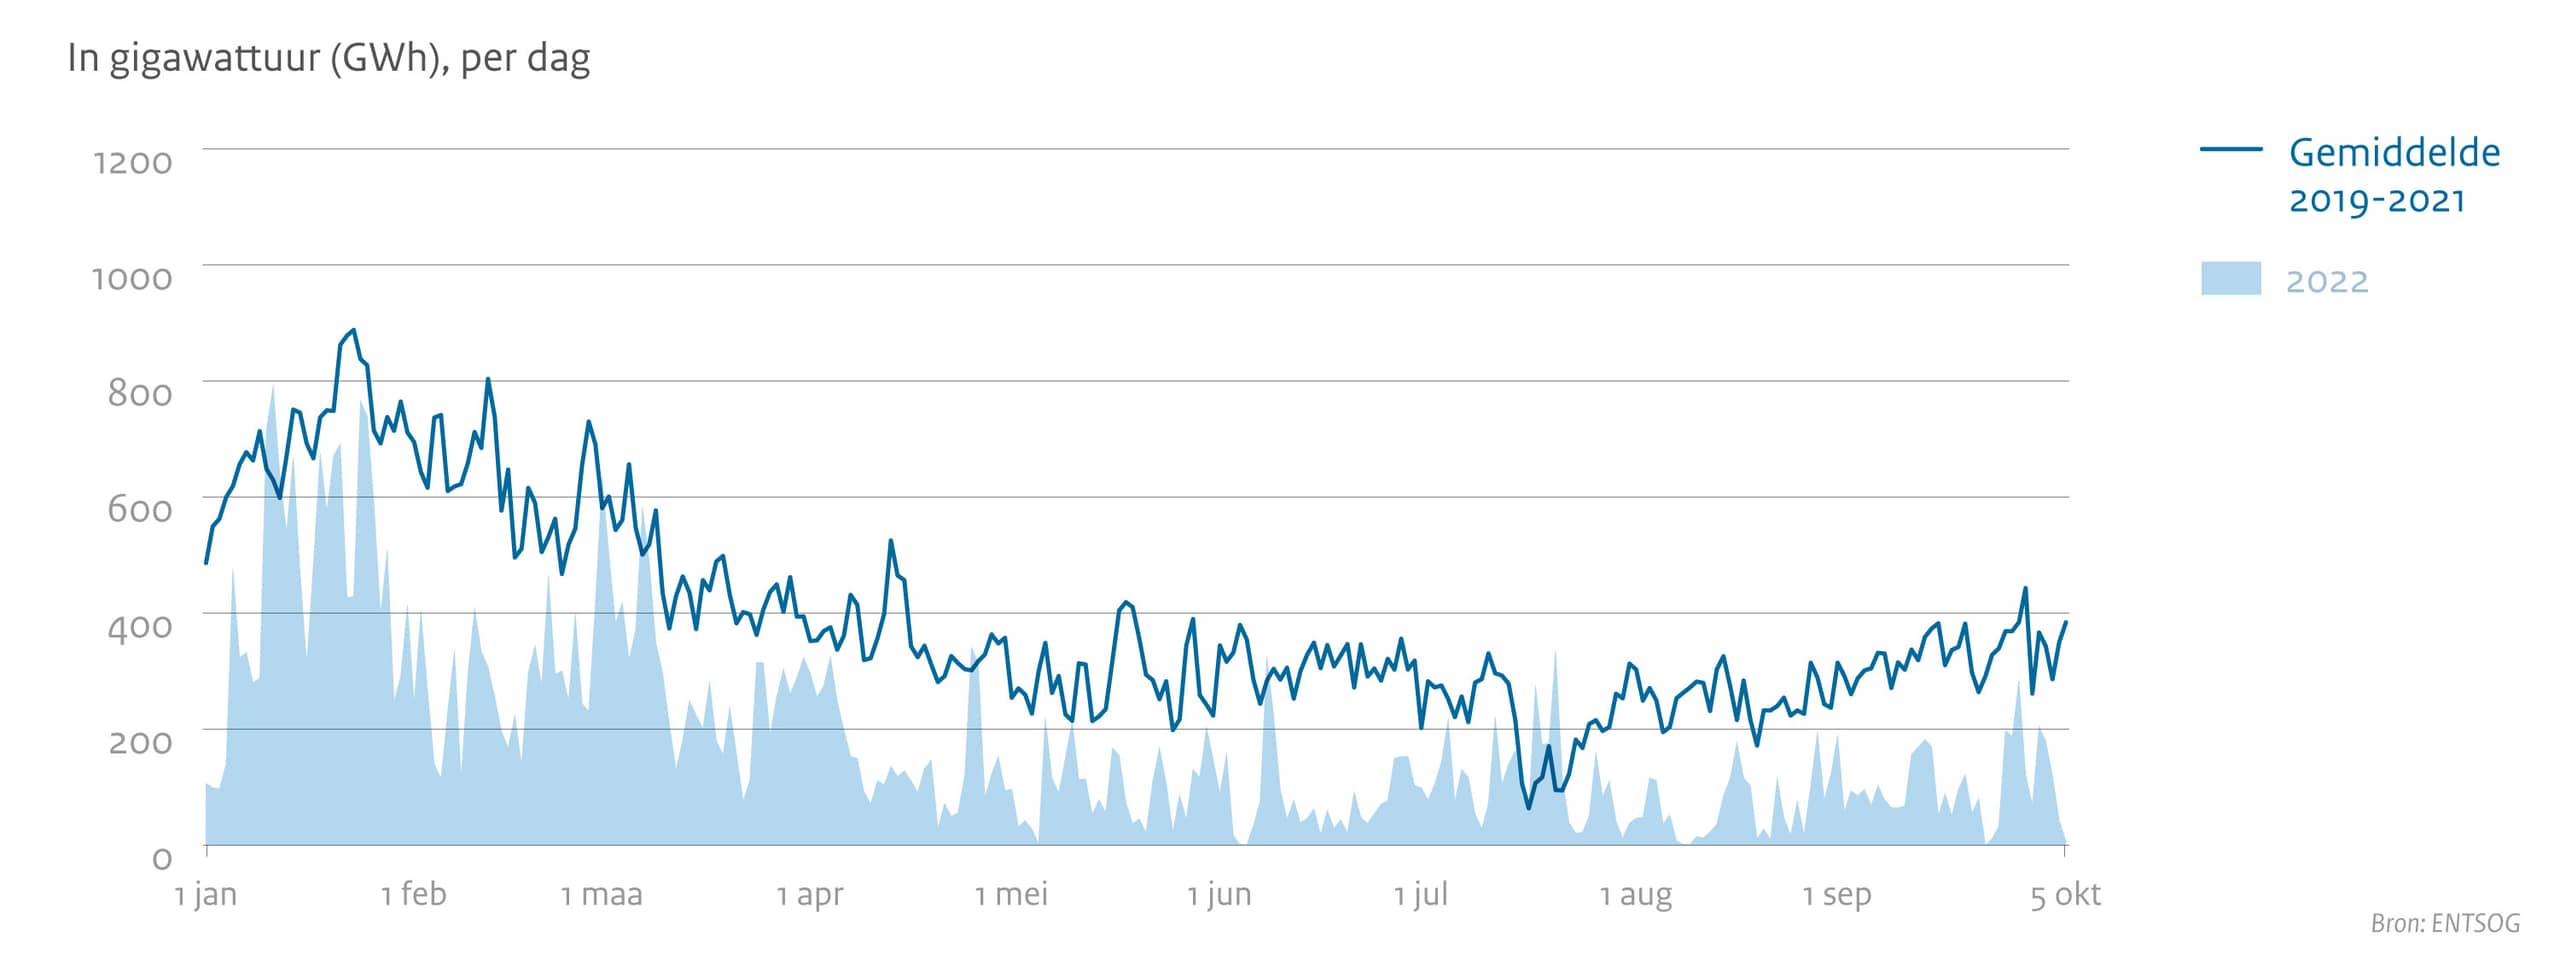
Gastransport van Nederland naar Duitsland
Bron: ENTSOG
| 2022 | 2019 - 2021 | |
|---|---|---|
| 1 januari | 870,2 GWh | 730,54 GWh |
| 1 februari | 763,4 GWh | 863,2 GWh |
| 1 maart | 673,07 GWh | 791,63 GWh |
| 1 april | 857,48 GWh | 760,16 GWh |
| 1 mei | 770,91 GWh | 638,79 GWh |
| 1 juni | 660,56 GWh | 609,47 GWh |
| 1 juli | 818,04 GWh | 497,27 GWh |
| 1 augustus | 692,25 GWh | 490,62 GWh |
| 1 september | 793,03 GWh | 519,31 GWh |
| 1 oktober | 988,96 GWh | 727,39 GWh |
| 5 oktober | 1053,68 GWh | 683,59 GWh |
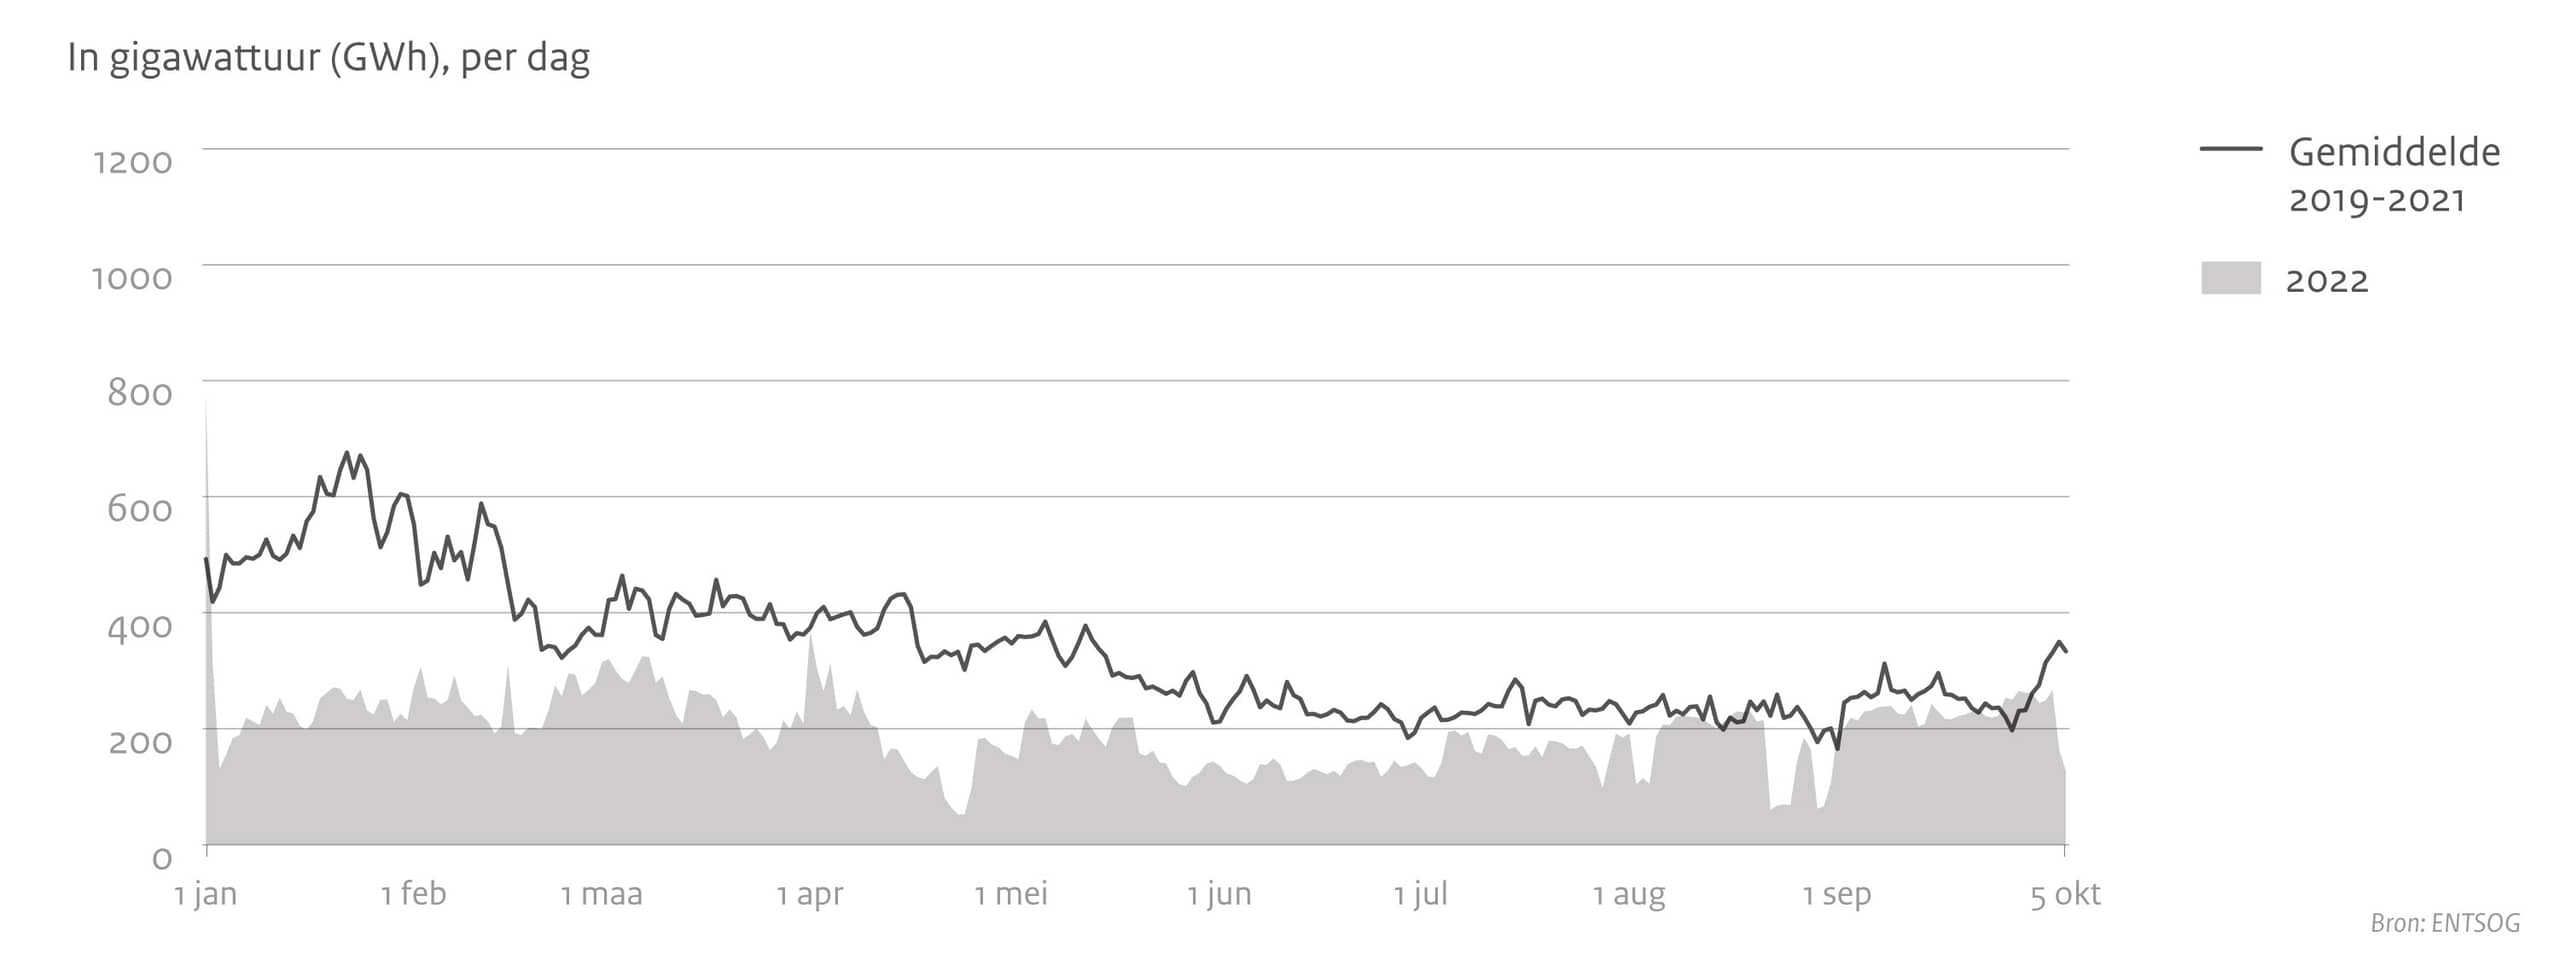
Gastransport van Duitsland naar Nederland
Bron: ENTSOG
| 2022 | 2019 - 2021 | |
|---|---|---|
| 1 januari | 106,55 GWh | 486,19 GWh |
| 1 februari | 242,39 GWh | 694,60 GWh |
| 1 maart | 634,71 GWh | 580,84 GWh |
| 1 april | 296,08 GWh | 351,73 GWh |
| 1 mei | 96,16 GWh | 254,01 GWh |
| 1 juni | 88,76 GWh | 344,16 GWh |
| 1 juli | 98,70 GWh | 201,76 GWh |
| 1 augustus | 37,82 GWh | 312,76 GWh |
| 1 september | 197,61 GWh | 368,60 GWh |
| 1 oktober | 204,18 GWh | 366,50 GWh |
| 5 oktober | 6.7 GWh | 383,95 GWh |
Gastransport van Nederland naar België
Bron: ENTSOG
| 2022 | 2019 - 2021 | |
|---|---|---|
| 1 januari | 768,04 GWh | 492,57 GWh |
| 1 februari | 272,14 GWh | 551,19 GWh |
| 1 maart | 314,67 GWh | 361,59 GWh |
| 1 april | 367,16 GWh | 374,17 GWh |
| 1 mei | 153,22 GWh | 347,07 GWh |
| 1 juni | 136,01 GWh | 212,33 GWh |
| 1 juli | 132,31 GWh | 218,85 GWh |
| 1 augustus | 191,63 GWh | 208,98 GWh |
| 1 september | 193,24 GWh | 165,46 GWh |
| 1 oktober | 244,26 GWh | 275,20 GWh |
| 5 oktober | 126,03 GWh | 333,65 GWh |
Gastransport van België naar Nederland
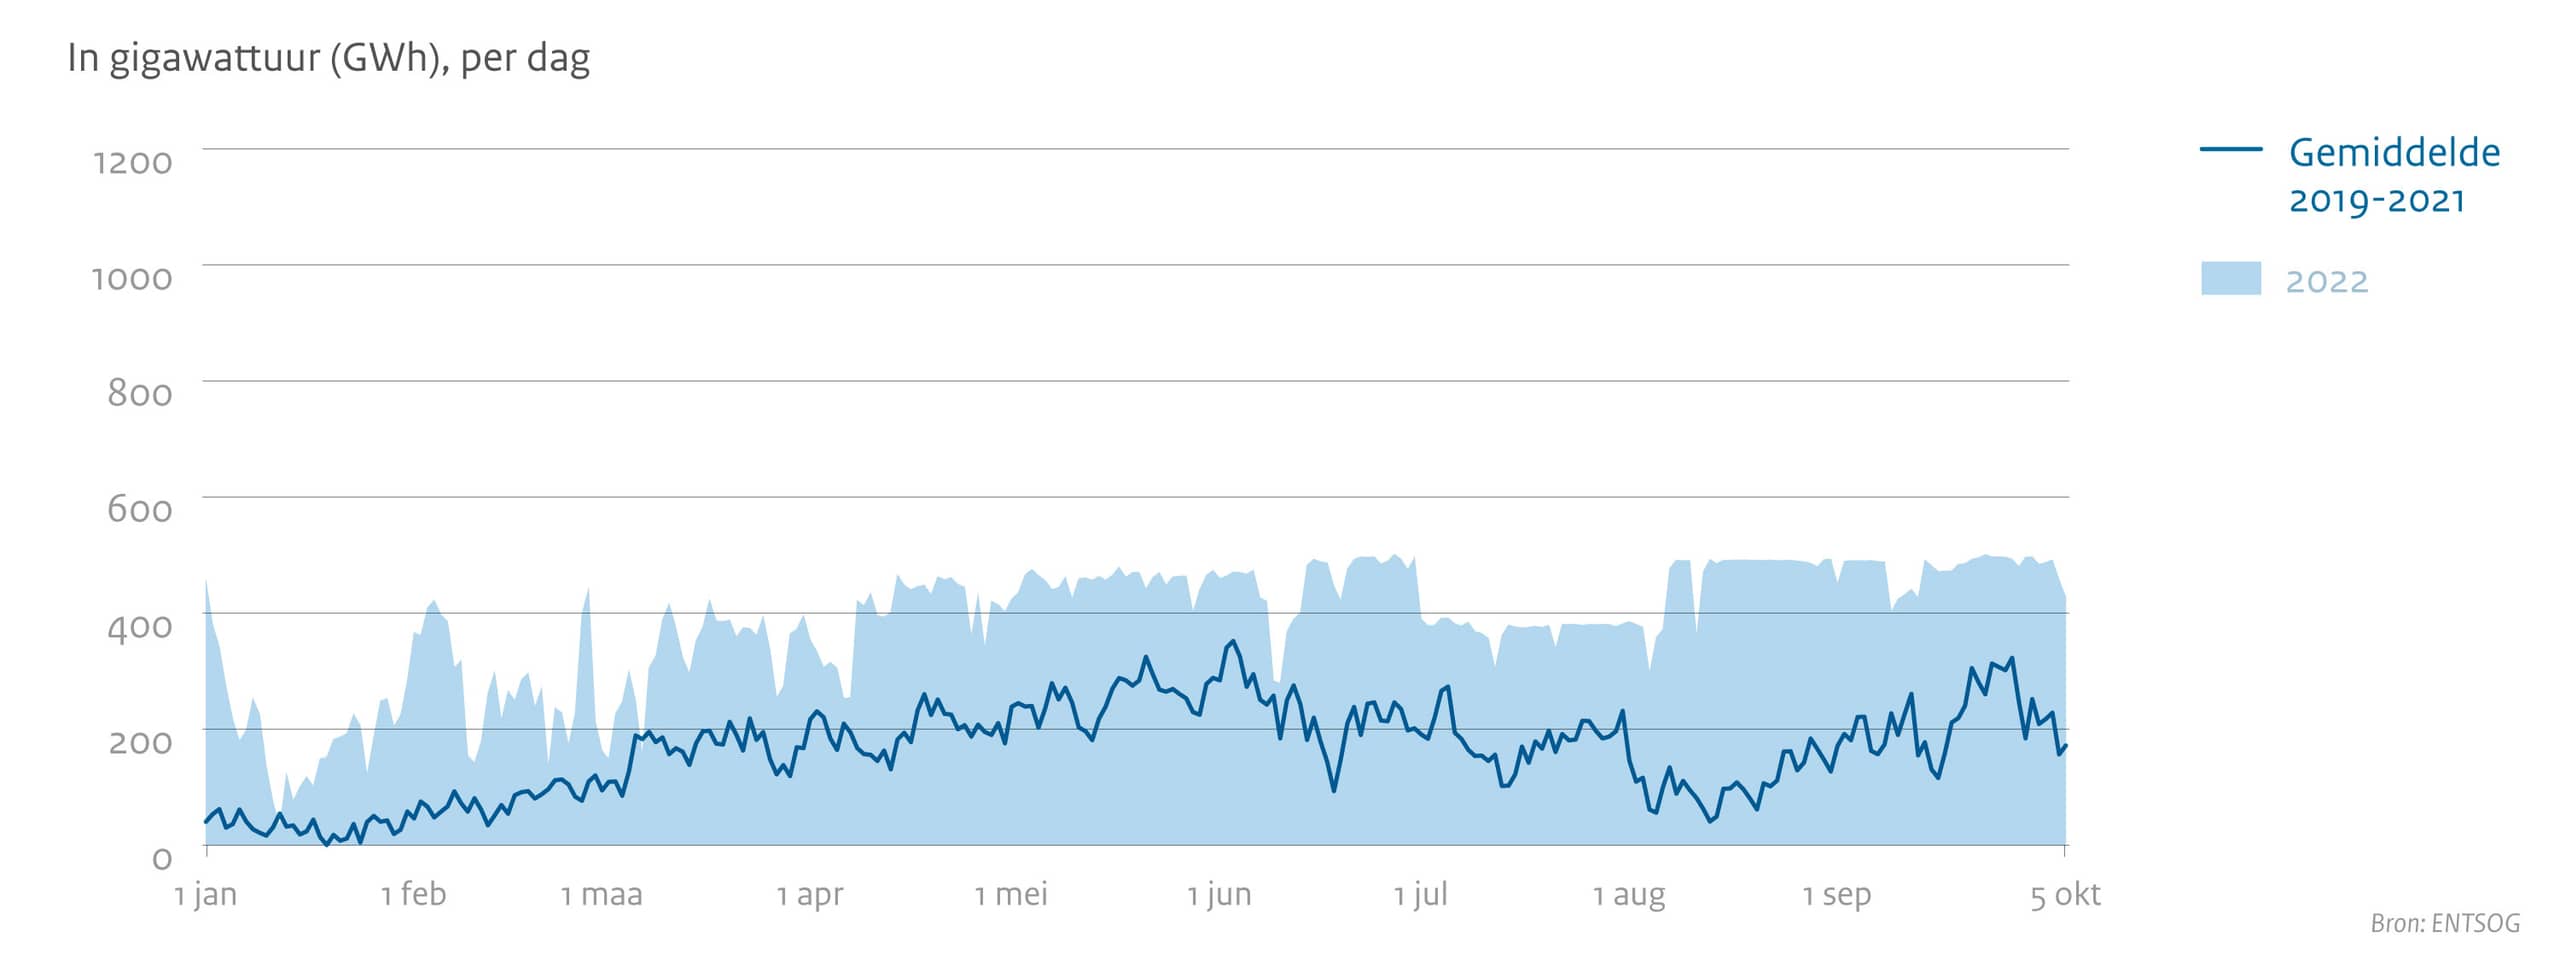
Bron: ENTSOG
| 2022 | 2019 - 2021 | |
|---|---|---|
| 1 januari | 457 GWh | 40,20 GWh |
| 1 februari | 366,75 GWh | 46,03 GWh |
| 1 maart | 162,98 GWh | 94,40 GWh |
| 1 april | 354,17 GWh | 216,76 GWh |
| 1 mei | 423,94 GWh | 238,56 GWh |
| 1 juni | 459,68 GWh | 284,04 GWh |
| 1 juli | 390,03 GWh | 190,72 GWh |
| 1 augustus | 385,47 GWh | 145,52 GWh |
| 1 september | 450,27 GWh | 171,08 GWh |
| 1 oktober | 484,13 GWh | 208,79 GWh |
| 5 oktober | 427,31 GWh | 171,74 GWh |
Aanvoer LNG naar Nederland
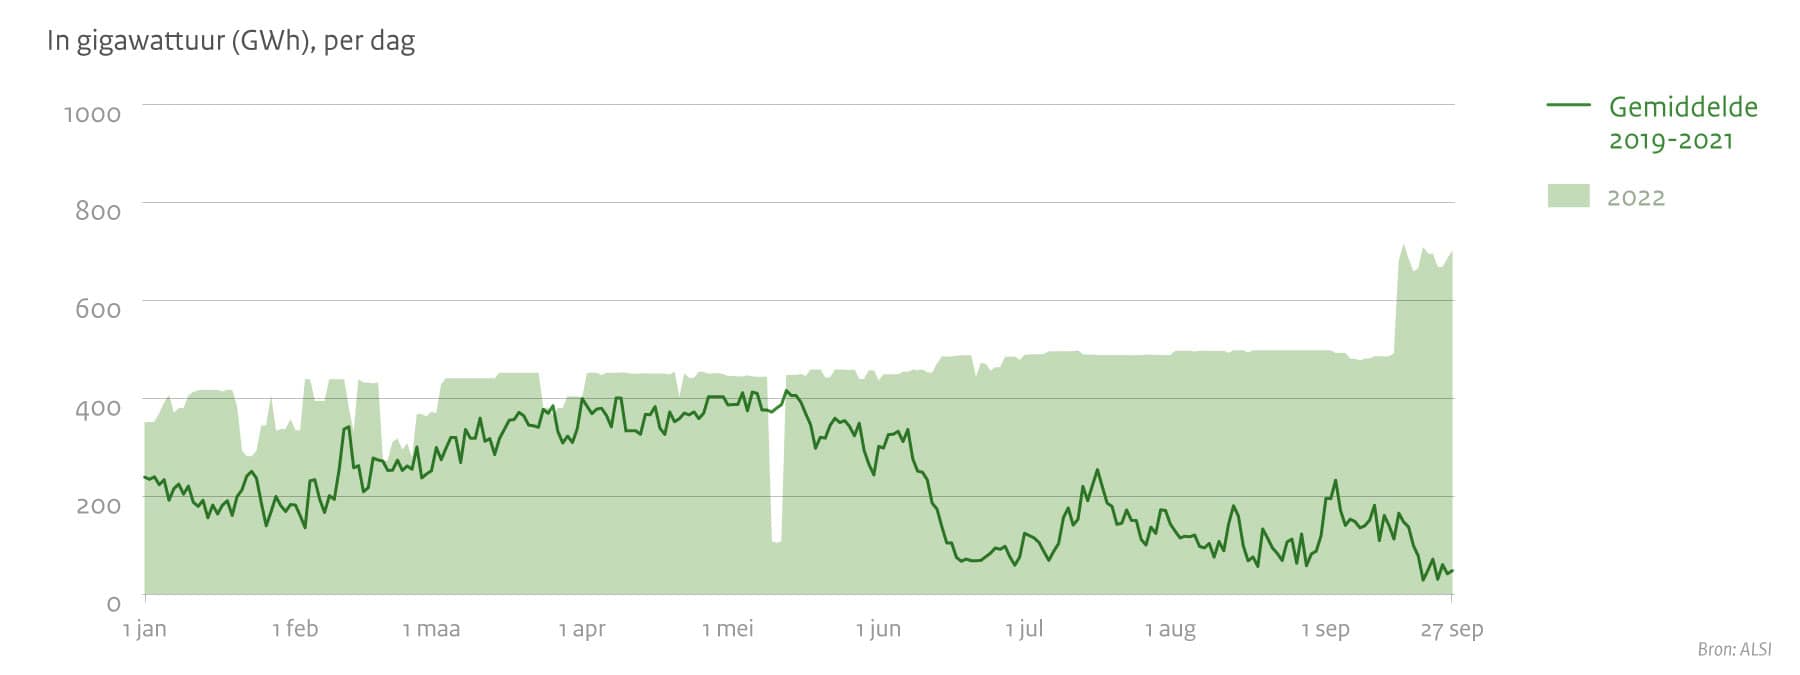
Bron: ALSI
| 2022 | 2019 - 2021 | |
|---|---|---|
| 1 januari | 351,6 GWh | 239,1 GWh |
| 1 februari | 334,6 GWh | 182,2 GWh |
| 1 maart | 372,7 GWh | 252,27 GWh |
| 1 april | 400,5 GWh | 399,67 GWh |
| 1 mei | 445,4 GWh | 386,57 GWh |
| 1 juni | 436,3 GWh | 302,03 GWh |
| 1 juli | 488,7 GWh | 124,37 GWh |
| 1 augustus | 496,9 GWh | 128,47 GWh |
| 1 september | 498,1 GWh | 195,5 GWh |
| 1 oktober | 701,7 GWh | 151,57 GWh |
| 4 oktober | 717,7 GWh | 115,1 GWh |
Toelichting
- Het doel van 80% voor de vulling van de gasopslagen is gehaald.
- De aanvoercapaciteit van LNG is met de succesvolle inbedrijfname van de Eemshaven Energy Terminal (EET) flink verhoogd.
- De gasprijs fluctueert sterk; de trend is dalend, maar de prijs is nog steeds erg hoog.
- Crisisniveau Vroegtijdige waarschuwing: De overheid ontvangt dagelijks vanuit de gassector gedetailleerde informatie over gasleveringen.